Avalanche price analysis: AVAX maintains value around $14.8

TL;DR Breakdown

  • Avalanche price analysis is bearish today.
  • The strongest resistance is present at $18.2.
  • The strongest support is present at $14.8.

Avalanche price analysis indicates the emergence of a bearish trend that is progressively gaining strength, with substantial potential for further downward movement. The AVAX/USD trading pair is currently priced at $14.8, showing a decline of 0.48% within the past 24 hours. Yesterday, the market witnessed a substantial downturn, marked by a swift downward trajectory, and is now showing early signs of optimistic bullish activity after falling below the $14.6 threshold. Additionally, there is a decrease in market volatility, creating a favorable environment for the bulls to initiate a significant rebound.

As of today, the price of Avalanche (AVAX) stands at $14.80, accompanied by a 24-hour trading volume of $203.96 million. The market capitalization of AVAX amounts to $4.93 billion, indicating a market dominance of 0.43%. Over the past 24 hours, the AVAX price experienced a decrease of -0.36%. Currently, the sentiment for Avalanche price prediction is bearish, while the Fear & Greed Index indicates a neutral value of 50.

The circulating supply of Avalanche is currently 332.90 million AVAX out of a maximum supply of 720.00 million AVAX. The yearly supply inflation rate stands at 23.70%, resulting in the creation of 63.79 million AVAX in the past year. In terms of market cap rankings, Avalanche holds the seventh position in the Proof-of-Stake Coins sector, first position in the Avalanche Network sector, and eleventh position in the Layer 1 sector.

AVAX/USD 1-hour analysis: Latest developments

Avalanche price analysis suggests an increasing trend in market volatility, implying that the AVAX/USD prices are becoming more susceptible to significant fluctuations. The Bollinger Bands exhibit a noteworthy resistance level for AVAX at $15, while concurrently presenting a significant support level at $14.6.

The AVAX/USD price has recently exhibited a downward movement, falling below the Moving Average curve. This occurrence signifies a bearish trend in the market, indicating that sellers are exerting significant influence and driving the price lower. The presence of bearish market participants has been consistently observed over the past few hours, suggesting that their impact is likely to endure. Furthermore, as the price approaches the support level, the prevailing bearish sentiment becomes more pronounced. This situation indicates the potential for a market breakout, emphasizing the prevailing downward pressure on AVAX/USD.

image 645Avalanche price analysis: AVAX maintains value around .8
AVAX/USD 1-hour price chart Source: TradingView

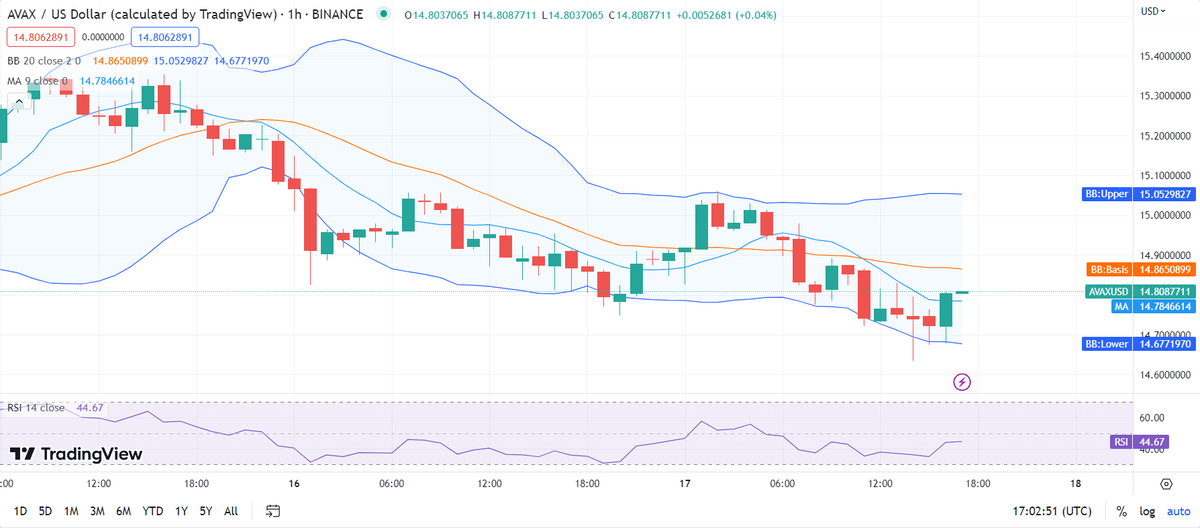
Avalanche price analysis reveals that the Relative Strength Index (RSI) currently stands at 43, indicating that the cryptocurrency is stable. Additionally, the RSI has been following a linear trajectory within the central neutral range, suggesting an equivalent selling and buying activity in the market.

Avalanche price analysis for 1-day

Avalanche price analysis indicates an increasing trend in market volatility, suggesting a higher probability of AVAX/USD experiencing fluctuations as volatility rises.
The Bollinger Bands depict a noteworthy resistance level for AVAX at $18, which holds considerable significance in impeding the price from further upward movement. Conversely, the Bollinger Bands establish a robust support level for AVAX at $14, indicating its efficacy in preventing the price from declining further. These levels serve as crucial benchmarks for traders and investors, offering valuable guidance for evaluating and analyzing AVAX’s price dynamics.

The AVAX/USD price is currently crossing below the Moving Average curve, signaling a bearish move in the market. Despite the market’s direction appearing relatively stable in recent days, bears have exerted control, weakening the position of the bulls. Additionally, the AVAX/USD price breaking below the support band suggests a potential market breakout.

image 647Avalanche price analysis: AVAX maintains value around .8
AVAX/USD 1-day price chart Source: TradingView

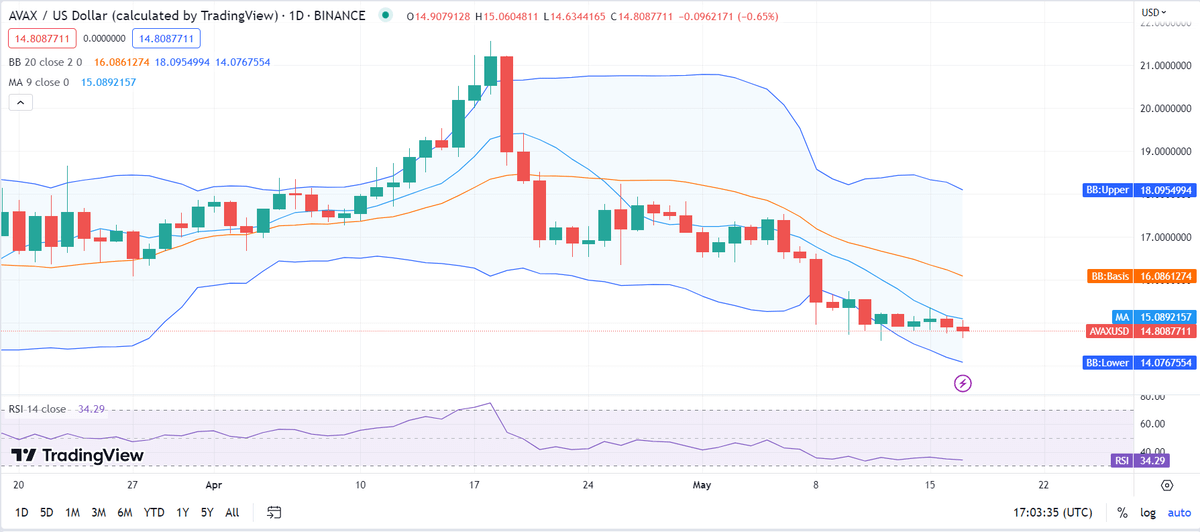
The Relative Strength Index (RSI) is currently at 34, suggesting that the cryptocurrency is undervalued. Moreover, the price of the cryptocurrency is displaying a downward trajectory within the undervalued region, indicating a decline in value and a shift towards devaluation, accompanied by increased selling activity. This situation has the potential to trigger a strong reversal movement in the market, potentially favoring a shift in momentum and providing an opportunity for a bullish market trend to emerge.

Avalanche Price Analysis Conclusion

Avalanche price analysis indicates a prevailing bearish trend in cryptocurrency. However, there exists a notable possibility of a reversal if the support level is breached. The current market conditions demonstrate a strong influence exerted by bearish participants, who have maintained control. Despite the challenges faced by the bulls, they have the potential for a significant resurgence if they can capitalize on a potential breakout. This presents an opportunity for a noteworthy recovery in the upcoming days.

Disclaimer. The information provided is not trading advice. Cryptopolitan.com holds no liability for any investments made based on the information provided on this page. We strongly recommend independent research and/or consultation with a qualified professional before making any investment decisions.

文章来源于互联网:Avalanche price analysis: AVAX maintains value around $14.8

Disclaimers:

1. You are solely responsible for your investment decisions and this info is not liable for any losses you may incur.

2. The copyright of this article belongs to the writer, it represents the writer's opinions only, not represents the site's ones. Not financial advice.

Previous 2023年5月18日 14:15
Next 2023年5月18日 15:12

Related articles

  • Lido Finance reassures investors amid security flaw concerns in LDO token contract

    TL;DR Breakdown Lido Finance acknowledges a security flaw in its LDO token but assures tokens are secure. SlowMist identifies the flaw, which allows transactions without sufficient funds. Lido Finance argues the issue is common to all ERC-20 tokens. Description Ethereum staking protocol Lido Finance has publicly acknowledged a known security flaw in its LDO token contract. The announcement came in response to a September 10 post by blockchain security firm SlowMist, which highlighted the vulnerability that could potentially enable “fake deposit” attacks on cryptocurrency exchanges, Cryptopolitan reported.  Despite the concerns, Lido Finance reassured investors … Read more Ethereum staking protocol Lido Finance has publicly acknowledged a known security flaw in its LDO token contract. The announcement came in response to a September 10 post by blockchain security firm SlowMist, which highlighted the vulnerability that could potentially enable “fake deposit” attacks on cryptocurrency exchanges, Cryptopolitan reported.  Despite the concerns, Lido Finance reassured investors that both Lido DAO LDO and staked-Ether (stETH) tokens remain secure. Lido Finance counters SlowMist’s allegations SlowMist’s analysis revealed that the flaw in the LDO token contract allows…

    Article 2023年9月12日
  • BoE governor shocks critics with bold rate hike defense

    Description The Bank of England’s Governor, Andrew Bailey, recently defended his institution’s bold decision to increase interest rates, brushing aside fierce criticism and reinforcing the BoE’s steadfast commitment to keeping the UK economy in check. This decisive move, surpassing market expectations, showcased the BoE’s autonomy and resolve in navigating the complex economic landscape. BoE navigating a … Read more The Bank of England’s Governor, Andrew Bailey, recently defended his institution’s bold decision to increase interest rates, brushing aside fierce criticism and reinforcing the BoE’s steadfast commitment to keeping the UK economy in check. This decisive move, surpassing market expectations, showcased the BoE’s autonomy and resolve in navigating the complex economic landscape. BoE navigating a complex economic landscape Under Bailey’s stewardship, the BoE has seen an unexpected rate hike of 50 basis points, deviating from the projected increase of 25. This audacious stride quickly sparked conversations among skeptics who contend that the bank’s response to escalating costs was neither timely nor definitive. Despite the harsh scrutiny, Bailey maintained that the Monetary Policy Committee’s (MPC) primary objective was unwavering: reining in inflation…

    Article 2023年7月1日
  • Take These Next Steps To Distinguish Recession vs Depression

    Description The ebb and flow of an economy often set the tone for many important decisions at both micro and macro levels. Whether it is a multinational corporation strategizing its financial trajectory or a household planning its budget, the state of the economy significantly impacts these choices. Therefore, an understanding of different economic conditions, such as … Read more The ebb and flow of an economy often set the tone for many important decisions at both micro and macro levels. Whether it is a multinational corporation strategizing its financial trajectory or a household planning its budget, the state of the economy significantly impacts these choices. Therefore, an understanding of different economic conditions, such as recessions and depressions, is crucial. This guide aims to present a comprehensive yet accessible exposition on the distinction between a recession vs depression. This guide intends to equip its readers with the understanding to navigate the complex landscape of economic downturns and their far-reaching implications. Contents hide 1 Understanding Economic Terminology 2 Overview of a Recession 3 Overview of a Depression 4 Analyzing the Key Differences…

    Article 2023年7月5日
  • Media companies meet AI companies to talk about this

    TL;DR Breakdown Top AI companies including OpenAI, Google, Microsoft, and Adobe are in talks with major media outlets regarding the use of news content to train AI technologies. These discussions aim to set a blueprint for future collaborations between AI and news companies, while addressing copyright concerns. In an era where technology and news media often intersect, a ground-breaking series of negotiations are on the horizon. Forefront players in artificial intelligence, including OpenAI, Google, Microsoft, and Adobe, are engaging in dialogues with top media houses to explore collaborations over the use of news content in training their AI technologies. AI technology meets news content Publishing magnates like News Corp, Axel Springer, The New York Times, and The Guardian are reported to be in preliminary discussions with the AI giants. The topic of conversation? The use of copyrighted news material to refine AI technologies like text chatbots and image generators. One suggested arrangement involves the AI firms paying subscription-like fees to the media houses, in exchange for content to develop technologies underpinning chatbots like OpenAI’s ChatGPT and Google’s Bard. This innovative…

    Article 2023年6月19日
  • Polkadot price analysis: DOT race to $5.29 after a bullish revival

    TL;DR Breakdown Polkadot price analysis shows an uptrend in the past 24 hours. DOT is trading at $5.29, up by 0.58 percent. Resistance and support levels have been identified at $5.30 and $5.22, respectively. The latest Polkadot price analysis shows a bullish market sentiment. In the past 24 hours, DOT prices have increased from $5.22 to $5.30 at the time of writing. Despite trading on a bearish note earlier, buyers have revived the market sentiment by pushing up prices. The markets were much higher during the day, with a peak of $5.30 before it dropped slightly to the current price. Resistance and support levels have been identified at $5.30 and $5.22, respectively, according to the Polkadot price analysis. If DOT prices are able to break beyond resistance, then they could go up a further level of $5.35 – $5.40. On the other hand, if prices face a bearish turn, they may dip to hit support levels of $5.20 – $5.15. Polkadot price analysis: DOT’s uptrend movement face resistance at the $5.30 mark On the daily chart, Polkadot’s price analysis shows…

    Article 2023年6月7日
TOP