
TL;DR Breakdown
- Cardano price analysis shows a bearish market sentiment.
- Resistance level for ADA is present at the $0.3723 mark.
- Support for ADA is seen at the $0.3645 level.
Today’s Cardano price analysis shows a bearish market sentiment. The price of ADA fell to $0.3655, indicating a decline continuation in the crypto asset’s value and increasing bearish pressure from the market. ADA touched the $0.3798 mark on 18th May and since then it has been on a downward spiral. The resistance level for ADA is present at the $0.3723 mark. The buying pressure around this level has been very weak which has resulted in the price struggling to breach it. The support for ADA is seen at the $0.3645 level, but any further decline in prices could see a breach of this mark as well as a further drop in prices.
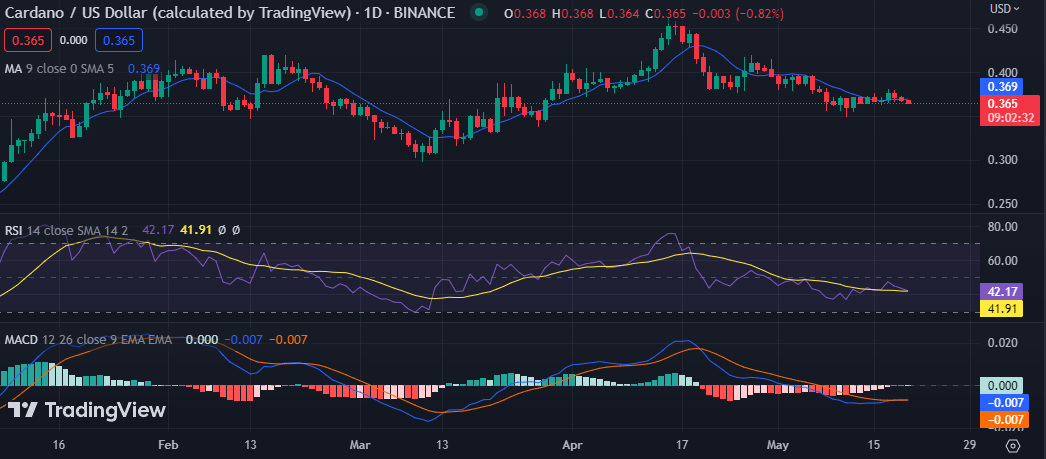
Cardano price analysis daily chart: ADA face strong resistance at the $0.3723 mark
The 1-day Cardano price analysis chart shows that the bears are dominating the market and prices have been consistently declining for the past few days. ADA has been trading on the negative side today and it is finding strong resistance at the $0.3723 mark. The market cap for ADA has also declined to $12.7 billion and the 24-hour trading volume for ADA is at $135 million.
 .3655 as bearish pressure intensifies" src="https://en.bitbili.com/wp-content/uploads/2023/05/frc-39d2a7a3c1677787627d41eb5447b421.png">
 .3655 as bearish pressure intensifies" src="https://en.bitbili.com/wp-content/themes/justnews/themer/assets/images/lazy.png" data-original="https://en.bitbili.com/wp-content/uploads/2023/05/frc-39d2a7a3c1677787627d41eb5447b421.png">
The moving average convergence divergence (MACD) indicator has formed a bearish crossover pattern, indicating that the trend is in favor of the bears. The relative strength index (RSI) is at 42.17 and it suggests that there could be a further decline in prices as buyers are not entering the market. Moreover, the moving average (MA) is sloping downwards with red candlesticks, suggesting that the bears are still in control.
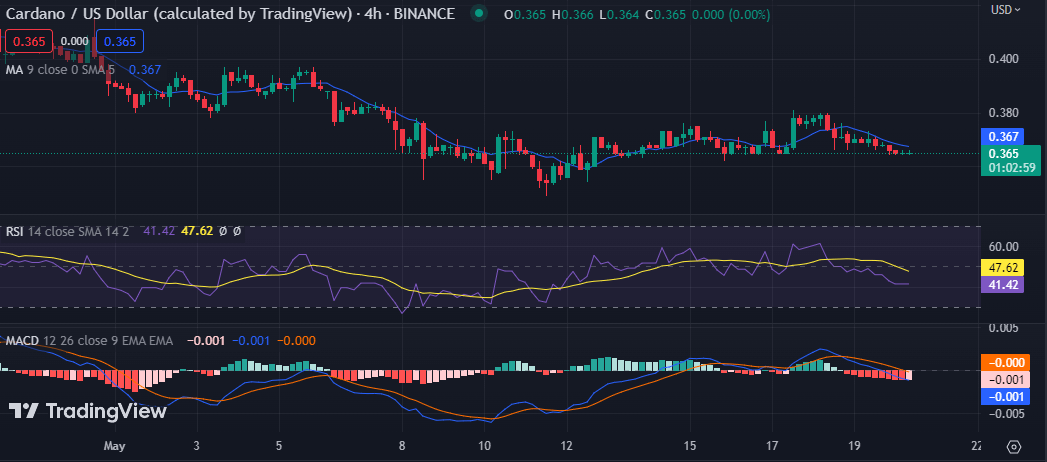
Cardano price analysis 4-hour chart: Recent developments and further indications
The hourly chart for Cardano price analysis shows that the bears are still pushing the price lower. ADA has been trading at the $0.3650 level for the past few hours and it is finding strong resistance at the $0.3676 mark. The selling pressure has been strong and it appears that the price could continue to decline if the buyers are unable to turn the trend around.
 .3655 as bearish pressure intensifies" src="https://en.bitbili.com/wp-content/uploads/2023/05/frc-37e8e27b5cc4c321727ccb6804653670.png">.3655 as bearish pressure intensifies" src="https://en.bitbili.com/wp-content/themes/justnews/themer/assets/images/lazy.png" data-original="https://en.bitbili.com/wp-content/uploads/2023/05/frc-37e8e27b5cc4c321727ccb6804653670.png">
The technical indicators in this timeframe are leaning toward the bearish side. The MACD indicator shows a negative value of -0.001 and it suggests that the sellers are in control of the trend. The red bars on the histogram also indicate that selling pressure is increasing. The moving average (MA) has a value of 0.367 above the current price which suggests that the trend is in favor of the bears. The relative strength index (RSI) has a value of 41.42 and it indicates that further selling pressure could be coming into play soon.
Cardano price analysis conclusion
Overall, Cardano price analysis shows that ADA is facing bearish pressure from the market and the price could continue to decline if buyers are unable to turn the trend around. The technical indicators suggest that the bears are still in control and any further decline in prices could see ADA breaching its support level at $0.3645.
文章来源于互联网:Cardano price analysis: ADA plummets to $0.3655 as bearish pressure intensifies