
Cardano price analysis: ADA retrace above the $0.3700 level after a bullish movement

TL;DR Breakdown

  • Cardano price analysis a bullish market sentiment.
  • ADA is trading at $0.3684 with a gain of 2.10 percent.
  • Resistance and support levels are located at $0.3732 and$0.3573 respectively.

The latest Cardano price analysis shows a bullish signal for the digital asset as it retraces above the $0.3700 level. The bullish trend is driven by increasing market sentiment and higher volumes over the past few days. The buying pressure pushed the price of ADA to a high of $0.3732, which makes it an attractive target for bulls. On the flip side, ADA is trading well above the major support level at $0.3573. If this level holds, it could bring a median range of $0.3570-$0.3730 for Cardano in the near future. The key resistance level at $0.3700 is also a good milestone for the bulls to break. Stability above this level could provide further upside potential for ADA.

The trading volume has been significantly high today, which could indicate that the digital asset is more likely to retrace above the $0.3700 level. If the buying pressure continues, Cardano may even break out of the current resistance range and reach a new high in the near future. The trading volume stands at $173 million with a gain of more than 50 percent and the market capitalization is at $12.8 billion, according to CoinMarketCap.

Cardano price analysis daily chart: Bulls face resistance at $0.3732

The daily chart of Cardano price analysis shows an uptrend trading pattern for the crypto asset. Despite ADA trading below the $0.3600 mark the bulls managed to push the price above the $0.3700 level before a pullback to the $0.3680 level. The buyers need to break the $0.3732 resistance level to confirm an upside trend in ADA prices.
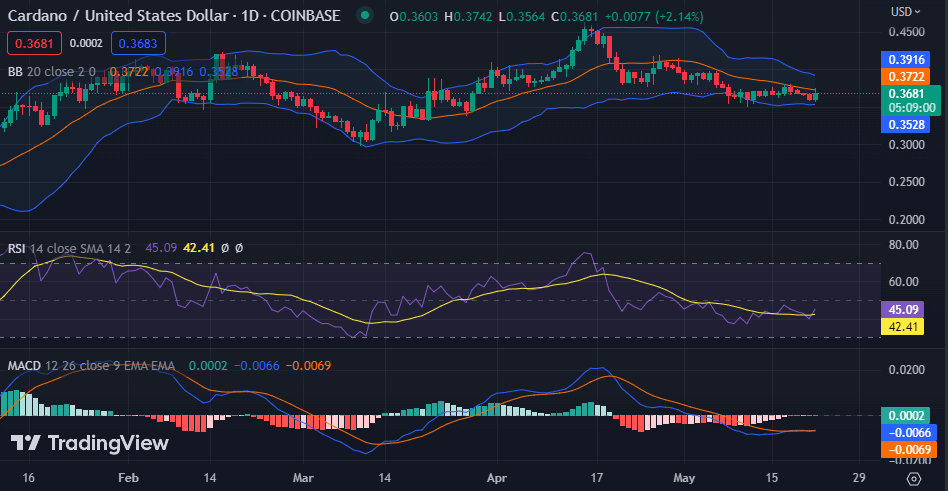
image 813.3700 level after a bullish movement" src="https://en.bitbili.com/wp-content/uploads/2023/05/frc-69c3301ee2faf84e98b15920deb1181e.png">Cardano price analysis: ADA retrace above the <img decoding=.3700 level after a bullish movement" src="https://en.bitbili.com/wp-content/themes/justnews/themer/assets/images/lazy.png" data-original="https://en.bitbili.com/wp-content/uploads/2023/05/frc-69c3301ee2faf84e98b15920deb1181e.png">
ADA/USD 1-day price chart. Source: TradingView

The Relative Strength Index (RSI) is at 45.09 and sloping upwards, which could be a sign of more upside potential in the digital asset. The MACD is trading near the zero level and may cross above to indicate an upward momentum for Cardano. The green bars in the histogram have started forming, which could also be a sign of a bullish trend in ADA prices. The Bollinger band indicator is still narrow but the green candlesticks have started forming on the chart, which could indicate a bullish breakout in the near future.

Cardano price analysis 4-hour chart: Recent developments and further indications

On the hourly chart Cardano price analysis, ADA is trading in a tight range of $0.3680-$0.3700. The buyers and sellers are in equilibrium, as the buyers try to push the price further above while the sellers attempt to keep it within a specific range. The buyers need to hold the upper hand in order to break the key resistance level of $0.3732.

The technical indicators on the 4-hour chart support the bullish sentiment in Cardano. The Relative Strength Index (RSI) is hovering above 50 index with a value of 55.31 displaying an increasing buying pressure in the market.
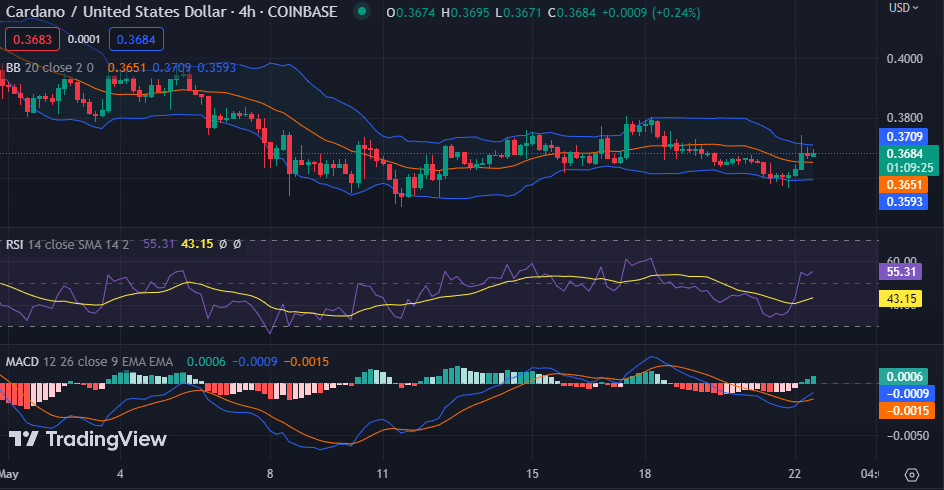
image 812.3700 level after a bullish movement" src="https://en.bitbili.com/wp-content/uploads/2023/05/frc-fd331bafd77402f86ba4a95ebebf23df.png">Cardano price analysis: ADA retrace above the <img decoding=.3700 level after a bullish movement" src="https://en.bitbili.com/wp-content/themes/justnews/themer/assets/images/lazy.png" data-original="https://en.bitbili.com/wp-content/uploads/2023/05/frc-fd331bafd77402f86ba4a95ebebf23df.png">
ADA/USD 4-hour price chart. Source: TradingView

The MACD is in positive territory and is likely to attain a positive value if the current trend continues. The histogram is also in positive territory and could indicate a further upside if the buyers remain in control. With the green candlesticks growing higher on the chart, the Bollinger band is likely to widen, indicating a bullish breakout could be in the cards for ADA.

Cardano price analysis conclusion

Overall, the Cardano price analysis indicates that ADA is trading in positive territory and there could be more upside potential. If the buyers gain further strength and manage to push prices above $0.3732, then the digital asset might target the next resistance at $0.3800 or higher levels in coming sessions. The key support level for ADA remains at the $0.3500 mark and if that is breached, then a deeper correction may be seen in the near future.

Disclaimer. The information provided is not trading advice. Cryptopolitan.com holds no liability for any investments made based on the information provided on this page. We strongly recommend independent research and/or consultation with a qualified professional before making any investment decisions.

文章来源于互联网:Cardano price analysis: ADA retrace above the $0.3700 level after a bullish movement

Disclaimers:

1. You are solely responsible for your investment decisions and this info is not liable for any losses you may incur.

2. The copyright of this article belongs to the writer, it represents the writer's opinions only, not represents the site's ones. Not financial advice.

Previous 2023年5月24日 09:37
Next 2023年5月24日 10:32

Related articles

  • UK wages grow 7.8% even with the job market slowing down

    TL;DR Breakdown The UK experienced remarkable wage growth, with average pay (excluding bonuses) increasing by 7.8% in the three months leading up to July. While wage growth is surging, other labor market indicators like unemployment and job vacancies are less optimistic. Bank of England Governor Andrew Bailey hints at a potential slowdown in rate hikes, while policy member Catherine Mann advocates a more aggressive tightening stance. Description The UK experienced record-breaking wage growth in the three months leading up to July. Based on official data released by the Office for National Statistics, the annual growth in average pay, excluding bonuses, remained at an impressive 7.8%, the highest rate since comparable records began in 2001. The growth was even more substantial at 8.5% … Read more The UK experienced record-breaking wage growth in the three months leading up to July. Based on official data released by the Office for National Statistics, the annual growth in average pay, excluding bonuses, remained at an impressive 7.8%, the highest rate since comparable records began in 2001. The growth was even more substantial at 8.5%…

    Article 2023年9月12日
  • BRICS common currency will be a major threat to USD

    TL;DR Breakdown BRICS nations, responsible for one-third of the world’s economic output, are considering a shared currency to challenge the U.S. dollar’s dominance in global trade. The discussion of a common currency will be a key agenda point at the upcoming BRICS summit in Johannesburg. This initiative is seen as a step towards fairer and more accessible international trade. Despite the complexities of introducing a common currency, there’s a focus on developing a unit specifically for settling cross-border trade, which reduces the difficulty and increases its feasibility. In the dynamic world of international finance, a potential seismic shift is on the horizon. A possible joint endeavor by BRICS nations to introduce a common currency could disrupt the longstanding dominion of the U.S. dollar in global trade. The BRICS nations, comprising Brazil, Russia, India, China, and South Africa, generate a collective one-third of global economic output, even outpacing the G7 economies in some respects. BRICS: Challenging the dollar’s dominance A critical agenda point during the upcoming BRICS summit in Johannesburg this August is the discussion of this shared currency idea. This…

    Article 2023年5月21日
  • World’s largest crypto casino, Stake.com faces security breach: Over $15 million in suspicious outflows detected

    TL;DR Breakdown Crypto-based betting platform Stake has been targeted in a security exploit, with over $15 million in suspicious outflows detected, consisting of 6,000 ether and $5.9 million in stablecoins. Stake has paused both deposits and withdrawals in the wake of the incident but has yet to issue an official statement. Description In a startling revelation that has sent shockwaves through the cryptocurrency community, the crypto-based betting platform Stake has reportedly been targeted in a security exploit involving suspicious outflows of over $15 million.  On-chain analysts have detected multiple irregular transactions from the platform, raising concerns about a potential security vulnerability affecting Stake’s wallet.  The anatomy of … Read more In a startling revelation that has sent shockwaves through the cryptocurrency community, the crypto-based betting platform Stake has reportedly been targeted in a security exploit involving suspicious outflows of over $15 million.  On-chain analysts have detected multiple irregular transactions from the platform, raising concerns about a potential security vulnerability affecting Stake’s wallet.  The anatomy of the exploit: What was lost? According to on-chain analyst Cyvers, approximately $15.7 million was transferred…

    Article 2023年9月5日
  • Liquity price analysis: LQTY recovers to $1.25 following a sudden dip

    TL;DR Breakdown The Liquity price analysis is bullish today. Resistance for LQTY is present at $1.41. Support for LQTY is present at $1.12. The current Liquity price analysis points towards an upward trend in the cryptocurrency today. Despite encountering bearish resistance in the previous day, the bulls have successfully propelled the price to $1.25 within the last four hours. The presence of a green candlestick signifies a renewed increase in the coin’s value following a sudden dip. Hourly price predictions align with these market trends for LQTY/USD, showcasing upward movement over the past four hours after a brief crash towards $0.93 that occurred within a five-minute timeframe. However, the token swiftly recovered from this dip. It’s important to note that resistance lies at the $1.41 level, potentially reintroducing selling pressure. LQTY/USD 1-day price chart: A resurgence of bullish sentiment sparks renewed market activity In the realm of one-day Liquity price analysis, positive developments emerge for cryptocurrency buyers, as the price exhibits significant recovery throughout the day. At the time of writing, the coin is trading at $1.25, and there are…

    Article 2023年5月26日
  • Atomic Wallet faces class action lawsuit over $100 Million crypto hack losses

    TL;DR Breakdown About 50 Russian and CIS clients launched a class action against Atomic Wallet after a $100 million crypto heist. The breach affected over 5,500 accounts; a Ukrainian group may have orchestrated the heist, challenging initial blame on North Korea’s Lazarus Group. Description A group of high-net-worth investors from Russia and the Commonwealth of Independent States has launched a class action against Atomic Wallet following a $100 million heist that has left investors reeling. The legal action is being coordinated by German lawyer Max Gutbrod and Boris Feldman, a co-founder of Moscow firm Destra Legal. Gutbrod, who was … Read more A group of high-net-worth investors from Russia and the Commonwealth of Independent States has launched a class action against Atomic Wallet following a $100 million heist that has left investors reeling. The legal action is being coordinated by German lawyer Max Gutbrod and Boris Feldman, a co-founder of Moscow firm Destra Legal. Gutbrod, who was once a partner at Baker & McKenzie in Moscow for more than 20 years, has stated that a group of lawyers is currently…

    Article 2023年8月24日
TOP