Polkadot price analysis: Bears extend downtrend, pushing DOT to $5.15 support

TL;DR Breakdown

  • Polkadot price analysis shows a bearish trend today.
  • Resistance for DOT/USD is present at $5.40.
  • Support for DOT/USD is present at $5.15.

The current outlook for Polkadot price analysis remains bearish as the market witnessed another significant decline today. The price levels have plunged to $5.24, displaying a consistent downward trend since yesterday, when bears seized control and shifted the momentum in their favor. Today, the bears have continued to dominate, extending the ongoing downtrend. There are anticipations of further price drops in the forthcoming hours, adding to the overall bearish sentiment.

DOT/USD 1-day price chart: DOT’s loss deepens by 1.50 percent amid ongoing bearish pressure

The 1-day Polkadot price analysis indicates a resumption of the downtrend, with bears regaining their momentum following a temporary reprieve. The cryptocurrency’s value has once again started to decline, reaching a low of $5.24 and experiencing a loss of over 1.50 percent. This downward trend aligns with the previous week’s performance, where the coin witnessed a four percent decrease in value over the past seven days. However, there is a silver lining, as the trading volume has seen a notable increase of 20.60 percent. Additionally, Polkadot maintains a market dominance of 0.57 percent among other cryptocurrencies.

dot1doiuwPolkadot price analysis: Bears extend downtrend, pushing DOT to .15 support
DOT/USD 1-day price chart. Source: TradingView

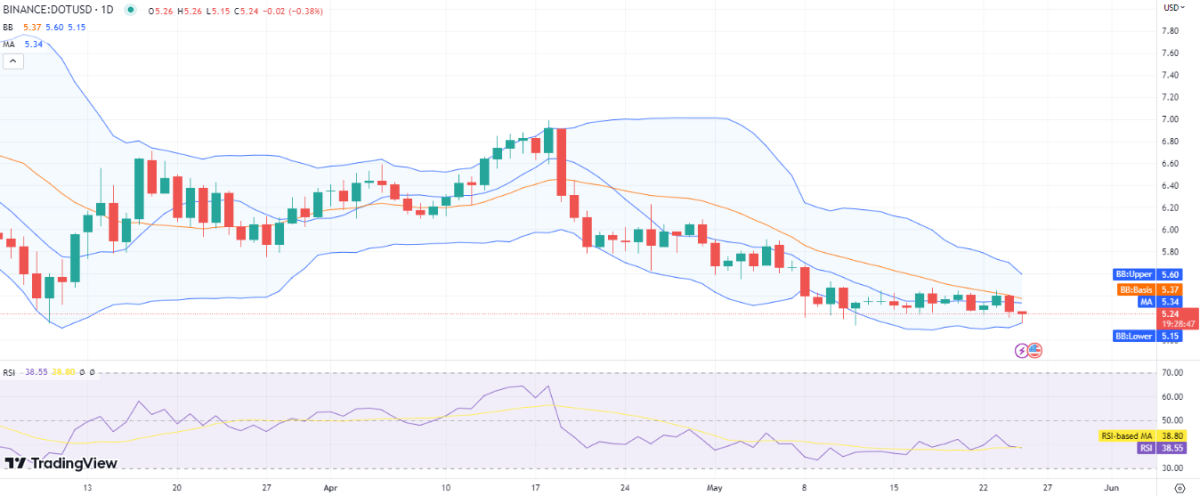
The current state of volatility in the cryptocurrency market is witnessing a decrease, as evident from the converging Bollinger bands. However, this reduction in volatility does not bode well for the future of the cryptocurrency. The upper limit of the volatility indicator is displaying more convergence, reaching the $5.60 level. This indicates potential resistance to the price of DOT. On the other hand, the lower limit of the Bollinger bands stands firmly at the $5.15 mark, indicating robust support for the cryptocurrency.

Examining the moving average (MA), it currently rests at $5.34, positioned above the current price level. This suggests a slightly bearish sentiment. As for the relative strength index (RSI), it is trading within the neutral range but has witnessed a decline, with a score of 38. This decrease in RSI signifies increased bearish pressure on the price of DOT.

Polkadot price analysis: Recent developments and further technical indications

Analyzing the 4-hour Polkadot price analysis, it becomes evident that the bearish momentum continues to push the price further downward. Currently standing at $5.24, the price reflects the prevailing bearish trend throughout the day. However, there are also glimpses of bullish activity on the hourly chart, as bulls attempt to provide support and facilitate a price recovery. This positive development serves as an encouraging sign for buyers. Nevertheless, it is important to note that selling pressure persists within the market, posing a challenge to sustained upward movement.

dot4hdopPolkadot price analysis: Bears extend downtrend, pushing DOT to .15 support
DOT/USD 4-hours price chart. Source: TradingView

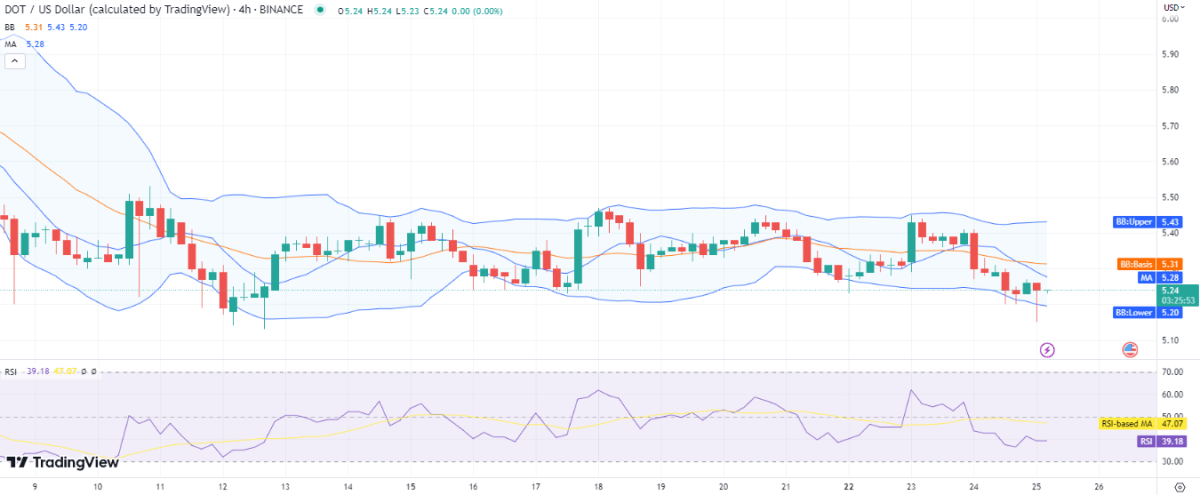
In relation to the Bollinger band mean average, the moving average (MA) is positioned at a lower level of $5.28. Examining the 4-hour price chart, the upper Bollinger band registers at $5.43, while the lower Bollinger band is set at $5.20. These values delineate the price range within which fluctuations are expected. Meanwhile, the relative strength index (RSI) has witnessed a decline, currently hovering around 39 on the 4-hour chart. This places the indicator in the lower half of the neutral zone, indicating a notable bearish opposition.

Polkadot price analysis conclusion

The Polkadot price analysis indicates the persistence of bearish pressure that has been evident since yesterday, leading to a decline in price levels, now reaching $5.24. While the bearish trend continues to exert its influence, there is a glimmer of hope. The presence of bulls in the market suggests the possibility of a price recovery, provided the market conditions support such a turnaround.

Disclaimer. The information provided is not trading advice. Cryptopolitan.com holds no liability for any investments made based on the information provided on this page. We strongly recommend independent research and/or consultation with a qualified professional before making any investment decisions.

文章来源于互联网:Polkadot price analysis: Bears extend downtrend, pushing DOT to $5.15 support

Disclaimers:

1. You are solely responsible for your investment decisions and this info is not liable for any losses you may incur.

2. The copyright of this article belongs to the writer, it represents the writer's opinions only, not represents the site's ones. Not financial advice.

Previous 2023年5月26日 21:11
Next 2023年5月26日 23:26

Related articles

  • Monero price analysis: Bearish momentum drives XMR down to a concerning $150

    TL;DR Breakdown Monero price analysis indicates slow bearish momentum. Resistance levels have dropped to $152 for Monero. Support for XMR is present at $149. The Monero price analysis indicates that bearish momentum dominated the XMR/USD market throughout the previous week. A continuous downward movement was observed, as depicted by the presence of red candlesticks on the chart. Today, the price levels plummeted to $150.34, with a sluggish yet negative momentum for buyers. Despite recent activity by the bulls, the current trends lean towards the bears’ favor, as they aim to push the price below the $150 threshold. XMR/USD 1-day price chart: XMR loses 0.63 percent more after a bearish encounter The one-day Monero price analysis indicates a marginal decline in demand as the market faces bearish sentiment at $150.34. A small red candlestick reflects a slight loss in value as the trend lines exhibit a downward movement. However, the increasing volatility poses a less favorable sign for buyers in the current circumstances. In the one-day XMR/USD chart, the moving average (MA) is calculated at $151.96, while the average Bollinger bands…

    Article 2023年5月21日
  • BRICS nations cut $18.9 Billion in US treasuries — What’s the impact?

    TL;DR Breakdown BRICS countries, including China, Brazil, India, and the UAE, have collectively sold off $18.9 billion in U.S. Treasury bonds within one month. The BRICS nations are increasingly looking to diversify their portfolios, possibly as a hedge against U.S. economic policies. Description Recent data from the U.S. Treasury Department reveals a significant move by members of the BRICS economic alliance—Brazil, Russia, India, China, and South Africa. China, the world’s second-largest holder of U.S. treasuries, has notably reduced its holdings from $835.4 billion in June to $821.8 billion in July. This marks a decline of $13.6 billion in … Read more Recent data from the U.S. Treasury Department reveals a significant move by members of the BRICS economic alliance—Brazil, Russia, India, China, and South Africa. China, the world’s second-largest holder of U.S. treasuries, has notably reduced its holdings from $835.4 billion in June to $821.8 billion in July. This marks a decline of $13.6 billion in just one month. Additionally, over the past year, China has offloaded about $117.4 billion worth of U.S. government debt. Other BRICS members follow suit…

    Article 2023年9月24日
  • Vauld crypto exchange gets court nod for board overhaul amid crisis

    TL;DR Breakdown Singapore-based Vauld crypto exchange gains court approval to revamp its board amid bankruptcy proceedings. Vauld has restarted its Know Your Customer checks, requiring existing clients to resubmit verification documents. In July 2022, Vauld halted customer withdrawals due to adverse market conditions, leading to a $200 million bank run. Description Singapore-based crypto exchange Vauld has received court approval to overhaul its board of directors. The move is part of the company’s ongoing bankruptcy proceedings, which began in August 2022. Darshan Bathija, Vauld’s co-founder, announced the news on X, formerly known as Twitter, on August 24. The new board will consist of a fresh CEO, a … Read more Singapore-based crypto exchange Vauld has received court approval to overhaul its board of directors. The move is part of the company’s ongoing bankruptcy proceedings, which began in August 2022. Darshan Bathija, Vauld’s co-founder, announced the news on X, formerly known as Twitter, on August 24. The new board will consist of a fresh CEO, a creditor representative, and a scheme manager. Moreover, the platform has resumed its Know Your Customer (KYC)…

    Article 2023年8月26日
  • XRP’s U.S. adoption hindered by SEC lawsuit, claims Pro-XRP lawyer John E Deaton

    TL;DR Breakdown Pro-XRP lawyer John E Deaton claims the XRP token lost nearly three years of U.S. adoption due to the SEC’s lawsuit against Ripple in December 2020. Ripple’s CEO, Brad Garlinghouse, supports Coinbase’s move, seeing potential for the USDC ecosystem’s growth. Deaton stresses that MoneyGram and Coinbase determined XRP was not a security, contrasting with the SEC’s later lawsuit against Ripple. Description In a recent statement on X (formerly Twitter), pro-XRP lawyer John E Deaton claimed that the XRP token had lost nearly three years of adoption in the United States. This setback is attributed to the United States Securities and Exchange Commission’s (SEC) lawsuit against Ripple, filed in December 2020. Deaton’s remarks highlight the impact of … Read more In a recent statement on X (formerly Twitter), pro-XRP lawyer John E Deaton claimed that the XRP token had lost nearly three years of adoption in the United States. This setback is attributed to the United States Securities and Exchange Commission’s (SEC) lawsuit against Ripple, filed in December 2020. Deaton’s remarks highlight the impact of the SEC’s actions on…

    Article 2023年8月23日
  • A closer look at how Americans are preparing for retirement

    TL;DR Breakdown Gen Z’s retirement savings in America have increased significantly, with their average 401(k) account balances growing by 34% over the last year, the highest increase among all generational cohorts. The average 401(k) balance for Gen Z is around $7,100, while the median balance is about $2,500. This disparity is due to high-balance accounts impacting the average figure. Fidelity Investments suggests that the ‘savings rate’, the proportion of pre-tax income allocated to retirement savings, is a good measure of retirement preparedness. As America’s youngest working generation, Gen Z, engages more actively in retirement savings, fascinating trends are emerging. Their account balances are growing at an unprecedented rate, outpacing other generations. This pattern has financial analysts and investors intrigued and suggests a new level of fiscal savvy among Gen Z. A new breed of investors: Gen Z surpasses expectations In an era marked by financial volatility, the youngest generation in the American workforce is setting a new trend. Gen Z, comprised of individuals born between 1997 and 2012, has seen a remarkable increase of 34% in their average 401(k) account…

    Article 2023年6月8日
TOP