Arbitrum price analysis: ARB price progresses to $1.17 level as a result of bullish run

TL;DR Breakdown

  • Arbitrum price analysis shows a bullish trend
  • Suppor for ARB/USD is present at $1.15
  • Arbitrum prices are facing resistance at $1.18

Arbitrum price analysis is bullish, with the ARB/USD pair rising to the $1.17 level. The price action recently created a bullish engulfing candlestick pattern, which indicates that the token is in an uptrend. The Arbitrum price is trading within the confines of a symmetrical triangle pattern, which could potentially break to the upside. Resistance is found at $1.18, which needs to be breached for a further upside move. Support is seen at the triangle bottom of $1.15, and if breached, a dip to $1.09 could be seen. 

The market capitalization for the token has been increasing steadily, indicating that there is strong demand for ARB tokens, and is currently at $1.45 billion. While the trading volume remains low at $208 million, the market cap is on an uptrend and may indicate further price appreciation in the near future.

Arbitrum price analysis 1-day chart: ARB is driven to $1.17 by bullish momentum.

The 1-day Arbitrum price analysis has bullish signs, with the price levels increasing, although the past week has been unfavorable for the bulls as the price levels have continued to decrease as of today the market is bullish. The bulls and the bears are currently in a battle for control of the market, but with the bullish momentum pushing prices higher, it shows that buyers are currently dominating. This could potentially lead to a break above resistance and further price increases for Arbitrum.

image 981Arbitrum price analysis: ARB price progresses to <img decoding=
ARB/USD 1-day price chart, Source: TradingView

The Relative Strength Index (RSI) also indicates bullish sentiment, with its reading of 46.21 heading towards the overbought zone. The moving average (MA) also confirms the bullishness, as it is in an uptrend and has risen above its short-term MA. The MACD chart for Arbitrum price analysis is further confirming the bullish trend as it shows an upward curve that points to further gains in the near future.

ARB/USD 4-hour price chart: Bulls are in control as the Arbitrum price approaches $1.17

The 4-hour Arbitrum chart is showing that the buyers are pushing for higher prices, and if the support at $1.15 holds, then a further upside may be expected in ARB. The coin reported an increase in value of 0.07 percent for the last 24 hours, indicating that the uptrend is gaining momentum. The MACD indicator is in bullish territory above the signal line, which indicates that there are increasing buying pressures and that they are likely to continue for some time.

image 982Arbitrum price analysis: ARB price progresses to <img decoding=
ARB/USD 4-hour price chart, Source: TradingView

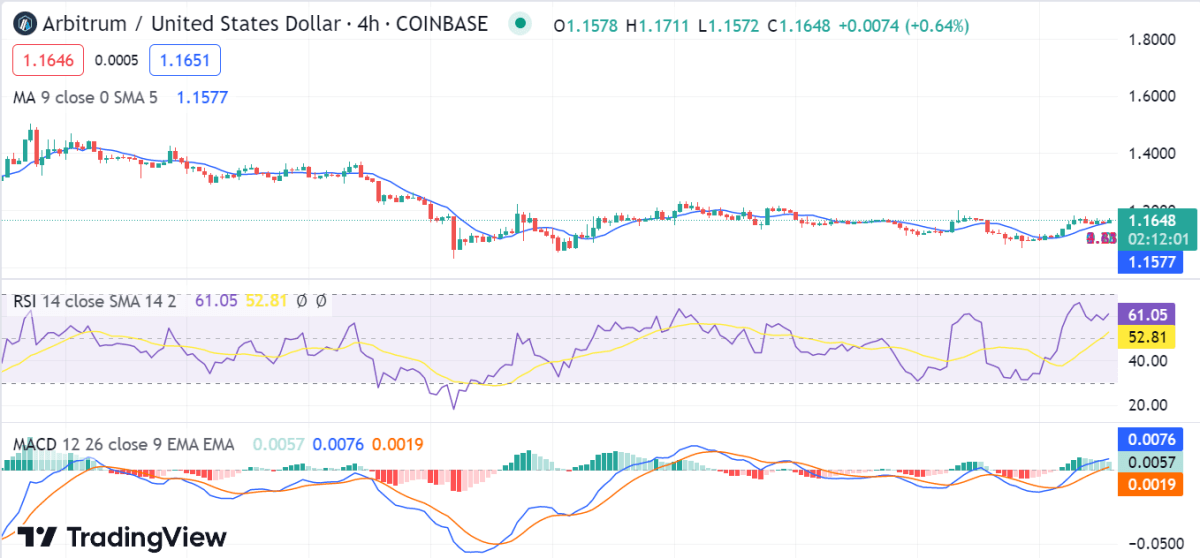
The 50 SMA is currently providing support for the ARB/USD pair as it is located below the current trading price. However, the 200 SMA is slowly catching up, and a crossover between these two moving averages could see Arbitrum target higher prices. In addition, the Relative Strength Index (RSI) has pushed into overbought territory above 60. This suggests that traders are buying the token at a faster rate than selling it and that further bullish momentum may be present.

Arbitrum price analysis conclusion

The overall outlook for Arbitrum looks bullish, and if the current trend continues, then the token could potentially test $1.20 in the short term. The key levels to watch are support at $1.15 and resistance at $1.08. A break above the $1.18 mark could indicate further upside, while a dip below $1.21 may confirm a reversal in trend. Both the hourly and the daily technical indicators are currently in a bullish state, and they are indicating that the bulls have the upper hand in the market.

Disclaimer. The information provided is not trading advice. Cryptopolitan.com holds no liability for any investments made based on the information provided on this page. We strongly recommend independent research and/or consultation with a qualified professional before making any investment decisions.

文章来源于互联网:Arbitrum price analysis: ARB price progresses to $1.17 level as a result of bullish run

Disclaimers:

1. You are solely responsible for your investment decisions and this info is not liable for any losses you may incur.

2. The copyright of this article belongs to the writer, it represents the writer's opinions only, not represents the site's ones. Not financial advice.

Previous 2023年5月30日 03:43
Next 2023年5月30日 05:29

Related articles

  • SEC greenlights first leveraged Bitcoin Futures ETF in the US

    TL;DR Breakdown SEC approves the Volatility Shares 2x Bitcoin Strategy ETF (BITX), the first leveraged Bitcoin futures ETF in the US. Signals a cautious shift in the SEC’s stance on cryptocurrencies, potentially opening the door for more crypto-based ETFs. Approval reinforces the legitimacy of Bitcoin futures, but SEC warns investors about associated risks. Description The United States Securities and Exchange Commission (SEC) has approved the Volatility Shares 2x Bitcoin Strategy ETF (BITX), marking the debut of the first leveraged Bitcoin futures ETF in the country​. This decision comes at a pivotal time as Bitcoin’s value recently surpassed the $31,000 milestone, a surge likely buoyed by major traditional investment companies … Read more The United States Securities and Exchange Commission (SEC) has approved the Volatility Shares 2x Bitcoin Strategy ETF (BITX), marking the debut of the first leveraged Bitcoin futures ETF in the country​. This decision comes at a pivotal time as Bitcoin’s value recently surpassed the $31,000 milestone, a surge likely buoyed by major traditional investment companies like BlackRock filing applications for spot Bitcoin ETFs​. Stuart Barton, the CEO of…

    Article 2023年6月26日
  • Uh-oh: U.S. gives China advise on economic slump

    TL;DR Breakdown The U.S. urges China to be transparent about its economic data. Concerns arise as China halts youth unemployment data publication. U.S. national security adviser, Jake Sullivan, stresses the importance of global financial stability. Description It seems the tables have turned. The U.S., in a bold move, is knocking on China’s door, urging transparency regarding the state of its economy. With China holding such a prominent position in the global economic theater, ripples from its slowdown could reverberate, impacting worldwide growth trajectories. U.S. concerned about China’s transparency Jake Sullivan, the … Read more It seems the tables have turned. The U.S., in a bold move, is knocking on China’s door, urging transparency regarding the state of its economy. With China holding such a prominent position in the global economic theater, ripples from its slowdown could reverberate, impacting worldwide growth trajectories. U.S. concerned about China’s transparency Jake Sullivan, the U.S. national security adviser, didn’t mince words. He voiced clear concern about Beijing’s recent decisions to halt the release of data about its swelling youth unemployment and its clampdown on corporate…

    Article 2023年8月24日
  • Liquity price analysis: LQTY price falls to $1.26 as bears reclaim control

    TL;DR Breakdown Liquity price analysis is bearish today LQTY resistance level is at $1.727 LQTY/USD support is at $1.012 Liquity price analysis is bearish today as the market is in a downward trend. The price has been decreasing over the past 24 hours, and it looks like this trend will continue in the near future. The bears are in control of the market, and it’s likely that we will see further declines as the day progresses. The price is currently below the $1.26 level, with a decrease of 3.79% at the time of writing. It is important to note that while LQTY prices may be bearish right now, there is still potential for a rebound in the near future. Traders should watch closely for any signs of upside momentum before entering into any positions. Liquity price analysis 1-day chart: LQTY price dips to $1.26 showing a negative sign  The 1-day Liquity price analysis shows a downward trend and bearish sentiment in the market. The bulls have been unable to break through the $1.727 resistance level, leading to a decrease in…

    Article 2023年5月23日
  • Europe’s core inflation dips before critical ECB call – Update

    TL;DR Breakdown Europe’s core inflation shows a decline, posing challenges for the European Central Bank (ECB). Overall inflation remained steady at 5.3% up to August, but core inflation cooled. Investors show less optimism for another ECB interest rate hike, influencing Euro and bond yields. Description Amid the grandeur of European economies, there’s an evident slide in core inflation, stirring a significant dilemma for the European Central Bank (ECB). Just when you thought the European financial landscape was stabilizing, numbers unveil a slightly different narrative. The balance? Whether to tighten the financial strings further or let the inflationary ghost roam a … Read more Amid the grandeur of European economies, there’s an evident slide in core inflation, stirring a significant dilemma for the European Central Bank (ECB). Just when you thought the European financial landscape was stabilizing, numbers unveil a slightly different narrative. The balance? Whether to tighten the financial strings further or let the inflationary ghost roam a tad longer. Let’s dissect what this means for Europe’s economic future. The Statisticians Speak The EU’s number crunchers have sounded the alarm,…

    Article 2023年9月1日
  • Nearly $16M in crypto lost to hacks in August

    TL;DR Breakdown In the month of August, a total of $15.8 million in cryptocurrencies fell victim to various hacks and exploits, marking a notable reduction from the previous month’s losses.  The attacks primarily targeted decentralized finance (DeFi) protocols, with no reported incidents affecting centralized financial entities. Prominent among the losses is the Exact protocol hack that transpired on August 18 which saw malicious actors pilfering 4,323.6 Ether, equivalent to around $7.2 million, from users’ deposits using a malicious deposit contract. Description In the month of August, a total of $15.8 million in cryptocurrencies fell victim to various hacks and exploits, marking a notable reduction from the previous month’s losses. According to a report published on August 31 by Immunefi, a prominent blockchain security firm, the combined tally of losses from hacks and fraudulent activities amounted to … Read more In the month of August, a total of $15.8 million in cryptocurrencies fell victim to various hacks and exploits, marking a notable reduction from the previous month’s losses. According to a report published on August 31 by Immunefi, a prominent blockchain…

    Article 2023年9月1日
TOP