VeChain price analysis: Price levels stumble below $0.01950 after bearish push

TL;DR Breakdown

  • The latest VeChain price analysis shows bearish signs.
  • The price has decreased to $0.01946 today.
  • Support is found at the $0.01887 level.

The VeChain price analysis is indicating that the price levels have dropped down to $0.01946 once again. The bearish slop has been continuous during the day, and it is further strengthened by today’s loss. More sellers are attracted to selling their assets, which is why VET price levels are going down. The short-term trend line is thus moving downward, which is a major bearish indication as well. Interestingly, the VET/USD price has been fluctuating quite far from its closing price caps for a long time, which makes intraday trading interesting but risky.

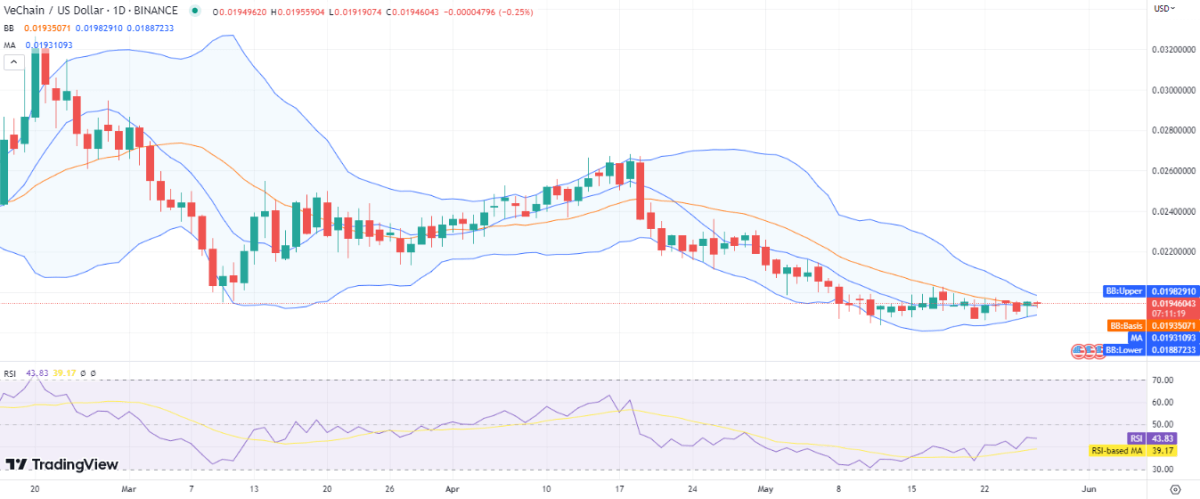
VET/USD 1-day price chart: Price deviates once again as bears strike

The 1-day VeChain price analysis is going strong for the bears, as price levels are downgrading again after a brief bullish interval. The price has decreased up to $0.01946, and it seems that the bears are trying to regain their lost momentum. The past week has been greatly supportive of the bears, and the trend is following up today as well. Other values include the moving average (MA) value, which is currently settled at the $0.01931 spot.

vet1d lat1.01950 after bearish push" src="https://en.bitbili.com/wp-content/uploads/2023/05/frc-c4ea0d3ca4f461029ece6035f28c611d.png">VeChain price analysis: Price levels stumble below <img decoding=.01950 after bearish push" src="https://en.bitbili.com/wp-content/themes/justnews/themer/assets/images/lazy.png" data-original="https://en.bitbili.com/wp-content/uploads/2023/05/frc-c4ea0d3ca4f461029ece6035f28c611d.png">
VET/USD 1- day price chart. Source: TradingView

The volatility is slowly decreasing, which could be taken as a negative hint for the future. The Bollinger band values in the above price chart are as follows; the upper Bollinger band is present at $0.01982, while the lower Bollinger band is at $0.01887. Whereas the Relative Strength Index (RSI) score is also going down again, and this time it has gone back to the 43 level.

VeChain price analysis: Recent developments and further technical indications

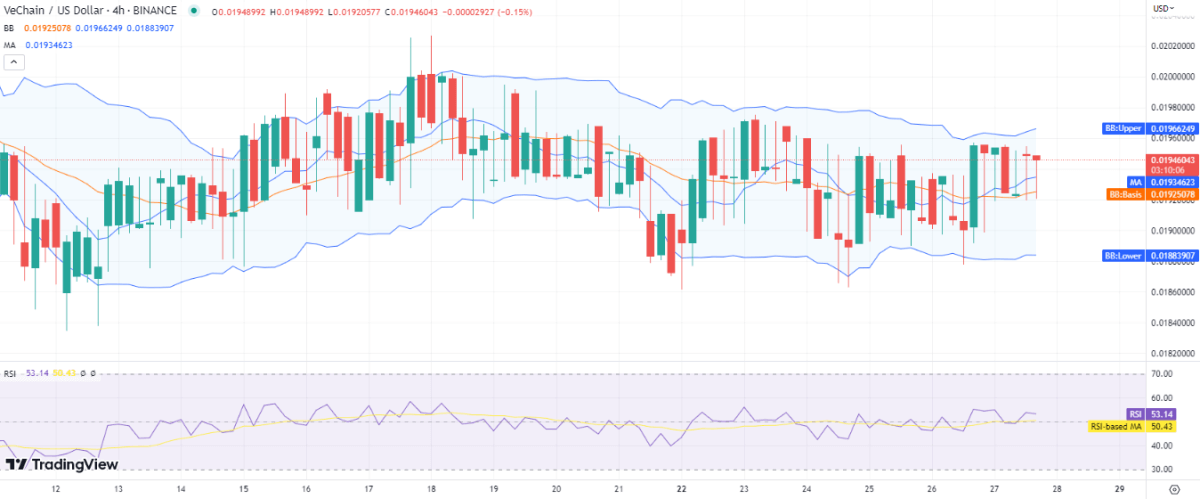
The 4-hour VeChain price analysis shows that the price has undergone a significant loss after bearish activity. The bears have been in the lead for the past few hours, and they are still maintaining their high position as the price has decreased further. The moving average value is above the current price of $0.01943 because of the recent bearish drive. Meanwhile, the Bollinger bands are securing an average of $0.01925 in the 4-hour price chart.

vet4hlat2.01950 after bearish push" src="https://en.bitbili.com/wp-content/uploads/2023/05/frc-a9bf884734e667d3b9335eb415c4e0e1.png">VeChain price analysis: Price levels stumble below <img decoding=.01950 after bearish push" src="https://en.bitbili.com/wp-content/themes/justnews/themer/assets/images/lazy.png" data-original="https://en.bitbili.com/wp-content/uploads/2023/05/frc-a9bf884734e667d3b9335eb415c4e0e1.png">
VET/USD 4-hours price chart: Source: TradingView

The upper Bollinger band is standing at the $0.01966 level, whereas the lower Bollinger band is now present at the $0.01883 level. If we talk about the RSI score in the following chart, then it has also flattened at 53 because of the bearish trend.

VeChain price analysis conclusion

The given 1-day and 4-hour VeChain price analysis is confirming the downtrend for the day, as the bears are at the leading edge right now. The bearish momentum has taken the price levels down to $0.01946, which is a significant decline in the price. There is an avid chance that the price will go even further lower than the current price level to maintain a new low, as it already swung as low as $0.01920.

Disclaimer. The information provided is not trading advice. Cryptopolitan.com holds no liability for any investments made based on the information provided on this page. We strongly recommend independent research and/or consultation with a qualified professional before making any investment decisions.

文章来源于互联网:VeChain price analysis: Price levels stumble below $0.01950 after bearish push

Disclaimers:

1. You are solely responsible for your investment decisions and this info is not liable for any losses you may incur.

2. The copyright of this article belongs to the writer, it represents the writer's opinions only, not represents the site's ones. Not financial advice.

Previous 2023年5月30日 12:04
Next 2023年5月30日 13:09

Related articles

  • UK’s inflation woes: Solutions on the horizon?

    Description While much of the world appears to be tempering their inflation issues, the UK still grapples with the specter of soaring consumer prices. China’s wading through deflation, and the US and eurozone seem to have controlled their escalating prices. Yet, the UK stands out, with its inflation rate soaring a staggering 17.6% over the past … Read more While much of the world appears to be tempering their inflation issues, the UK still grapples with the specter of soaring consumer prices. China’s wading through deflation, and the US and eurozone seem to have controlled their escalating prices. Yet, the UK stands out, with its inflation rate soaring a staggering 17.6% over the past two years. This rampant inflation has the nation’s financial pundits scratching their heads, especially when July’s figures hint that the major culprits are food and energy prices, notorious for their volatility. Bank of England’s Sisyphean Task The Bank of England has been in the trenches, trying to reign in this economic beast. Despite hiking interest rates to a 15-year high of 5.25% after 14 successive raises,…

    Article 2023年8月20日
  • Coinbase (COIN) continues strong performance amid regulatory pressure

    TL;DR Breakdown Coinbase’s stock price rises by nearly 6% despite SEC lawsuit concerns, reflecting investor confidence. The company repurchases $64.5 million worth of Convertible Senior Notes at a discount, showcasing its commitment to shareholder value. Coinbase reports a smaller net loss and a surge in subscription revenue, indicating a rebound after a challenging year. Description Coinbase, the largest cryptocurrency exchange in the United States, saw its stock price climb nearly 6% over the past week, defying the overhang of the ongoing lawsuit by the U.S. Securities and Exchange Commission (SEC). Despite regulatory uncertainties, Coinbase’s stock closed the week’s session at $55.59, marking a 5.93% increase. Since the SEC’s announcement of … Read more Coinbase, the largest cryptocurrency exchange in the United States, saw its stock price climb nearly 6% over the past week, defying the overhang of the ongoing lawsuit by the U.S. Securities and Exchange Commission (SEC). Despite regulatory uncertainties, Coinbase’s stock closed the week’s session at $55.59, marking a 5.93% increase. Since the SEC’s announcement of the lawsuit on June 6, the stock has risen more than 7%,…

    Article 2023年6月21日
  • Binance Coin price analysis: BNB increases value to $307.1

    TL;DR Breakdown Binance Coin price analysis is bullish today. The strongest support is present at $302. The strongest resistance is present at $319.1. Binance Coin price analysis indicates a prevailing bullish trend, suggesting a sustained and potentially increased positive momentum in the market. The current conditions favor the bulls, who are expected to maintain their dominance and potentially exert even greater control over the market in the near future. Additionally, Binance Coin has witnessed a notable surge in value, rising from $301 to $308.1 and maintaining stability around this level. This price development suggests the potential for further upward movement in the foreseeable future. The present value of Binance Coin (BNB) stands at $308.15, accompanied by a 24-hour trading volume of $1.30 billion. Its market capitalization is estimated to be $48.03 billion, and it holds a market dominance of 4.24%. Over the past 24 hours, the BNB price has experienced a modest increase of 0.81%. Currently, market sentiment for Binance Coin’s price prediction is bearish, while the Fear & Greed Index stands at 49, indicating a neutral outlook. The circulating…

    Article 2023年5月29日
  • Everything to know about the list of tokens that the SEC says are securities

    TL;DR Breakdown The US Securities and Exchange Commission (SEC) has publicly listed a series of crypto assets it deems as securities, applying the Howey Test. Prominent tokens listed include XRP, Decentraland (MANA), and Beaxy Token (BXY). Binance and its CEO, Changpeng Zhao, face SEC scrutiny for alleged securities law violations. In the fluid universe of cryptocurrency, the US Securities and Exchange Commission (SEC) has recently sharpened its perspective on regulations, laying out a clear delineation of tokens it deems to be securities. The declaration came in April in the form of a list that was shared publicly by the Commission’s five members, an aggregation that comprises high-profile crypto assets that are considered to have been put forth as unregistered securities. The Howey Test: The regulatory litmus test For the classification of these digital assets, the SEC employed the widely accepted Howey Test. This established legal precedent comes with four tenets: the act of investing money, participation in a common business, harboring a reasonable expectation of profits, and the derivation of those profits from the efforts of other parties. A token…

    Article 2023年6月10日
  • BRICS nations cut $18.9 Billion in US treasuries — What’s the impact?

    TL;DR Breakdown BRICS countries, including China, Brazil, India, and the UAE, have collectively sold off $18.9 billion in U.S. Treasury bonds within one month. The BRICS nations are increasingly looking to diversify their portfolios, possibly as a hedge against U.S. economic policies. Description Recent data from the U.S. Treasury Department reveals a significant move by members of the BRICS economic alliance—Brazil, Russia, India, China, and South Africa. China, the world’s second-largest holder of U.S. treasuries, has notably reduced its holdings from $835.4 billion in June to $821.8 billion in July. This marks a decline of $13.6 billion in … Read more Recent data from the U.S. Treasury Department reveals a significant move by members of the BRICS economic alliance—Brazil, Russia, India, China, and South Africa. China, the world’s second-largest holder of U.S. treasuries, has notably reduced its holdings from $835.4 billion in June to $821.8 billion in July. This marks a decline of $13.6 billion in just one month. Additionally, over the past year, China has offloaded about $117.4 billion worth of U.S. government debt. Other BRICS members follow suit…

    Article 2023年9月24日
TOP