Polkadot price analysis: DOT declines tremendously to $5.29

TL;DR Breakdown

  • Polkadot price analysis is bearish today.
  • The strongest support is present at $5.23.
  • The strongest resistance is present at $5.49.

Polkadot price analysis reveals a relatively upbeat approach today; the price has gained most of its lost value. In the last few days, the cost of DOT has received much positive attention and has increased to a slight degree. On May 30, 2023, the price suddenly decreased from $5.53 to $5.31. However, the price started to gain further positive momentum the same day and regained a value of as much as $5.35. On May 31, 2023, the price saw slight highs and reached an all-day high of $5.33. Moreover, the currency price of the cryptocurrency remains around $5.29.

The present trading price of Polkadot is $5.29, accompanied by a 24-hour trading volume of $225.39 million. Its market capitalization stands at $5.23 billion, contributing to a market dominance of 0.46%. Over the past 24 hours, the price of Polkadot has decreased by -2.73%. Presently, the sentiment for Polkadot’s price prediction is bearish, while the Fear & Greed Index indicates a neutral reading of 51.

The circulating supply of Polkadot is currently 987.58 million DOT out of a maximum supply of 1.00 billion DOT. The yearly supply inflation rate is presently 10.02%, resulting in the creation of 89.92 million DOT in the previous year. In terms of market capitalization, Polkadot currently holds the sixth position in the Proof-of-Stake Coins sector and the tenth position in the Layer 1 sector.

DOT/USD 1-hour price analysis: Recent updates

Based on the Polkadot price analysis, it seems that the market volatility tends to converge towards a closing movement, leading to a reduced susceptibility of DOT prices to sudden and drastic changes. Currently, the upper limit of the Bollinger’s band is positioned at $5.49, representing a significant resistance level for DOT. Conversely, the lower limit of the Bollinger’s band is situated at $5.23, acting as a robust support level for DOT.

According to the DOT/USD price chart analysis, it is observed that the price of DOT has crossed below the Moving Average (MA) curve. This crossing is generally interpreted as a bearish signal in the market, suggesting a potential downward trend for DOT. Furthermore, the price is currently attempting to break through the Moving Average band, indicating a possible reversal in the prevailing market trend.

image 1092Polkadot price analysis: DOT declines tremendously to .29
DOT/USD 1-hour price chart Source: TradingView

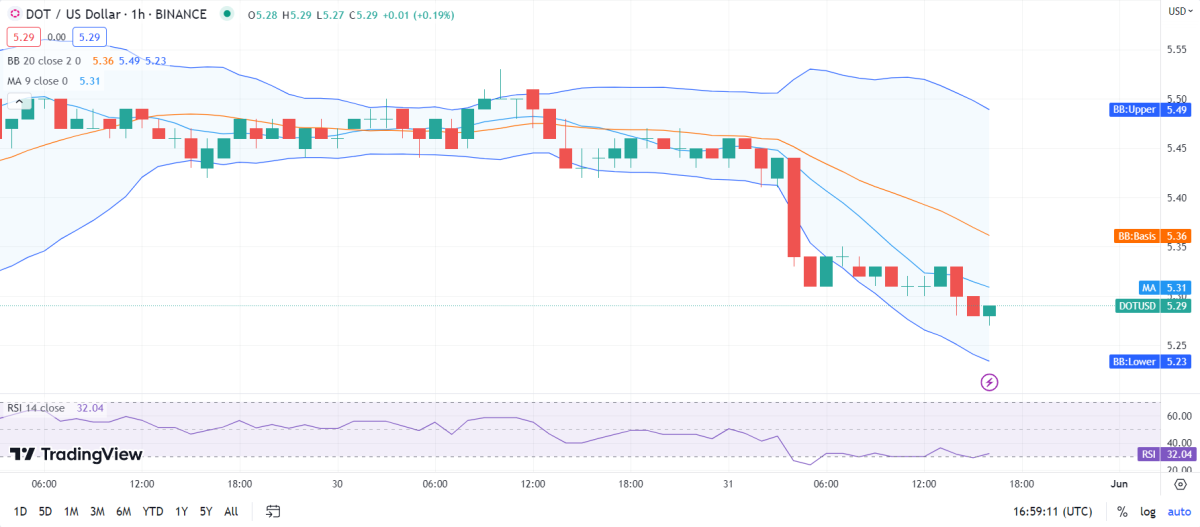
Based on the Polkadot price analysis, the Relative Strength Index (RSI) score for DOT/USD is currently at 32, which indicates that the asset is in the undervalued region. The RSI score has shown an upward movement within this undervalued region, suggesting a potential move toward stability. This implies that buying activity in the market is dominant, leading to the DOT/USD price reaching a point of uncertainty.

Polkadot price analysis for 1-day

Polkadot price analysis reveals the market volatility to enter a slight consistent movement; it’s beginning to squeeze as the resistance and support bands move toward each other. Based on the analysis, it is anticipated that the price of the cryptocurrency will continue to exhibit the current level of volatility and become less prone to abrupt changes. The upper limit of the Bollinger’s band, currently positioned at $5.49, is expected to serve as a significant resistance level for DOT. Conversely, the lower limit of the Bollinger’s band, situated at $5.21, is anticipated to act as a robust support level for DOT. These levels indicate key price thresholds that may influence the future movements of DOT.

Based on the Polkadot price analysis, it seems that the DOT/USD price has recently crossed over the Moving Average (MA) curve, indicating a bullish movement in the market. The price is moving upward, and there is a positive trend in the market. It appears that the bulls have gained control of the market and are likely to maintain their dominion for the next few weeks.

image 1093Polkadot price analysis: DOT declines tremendously to .29
DOT/USD 1-day price chart Source: TradingView

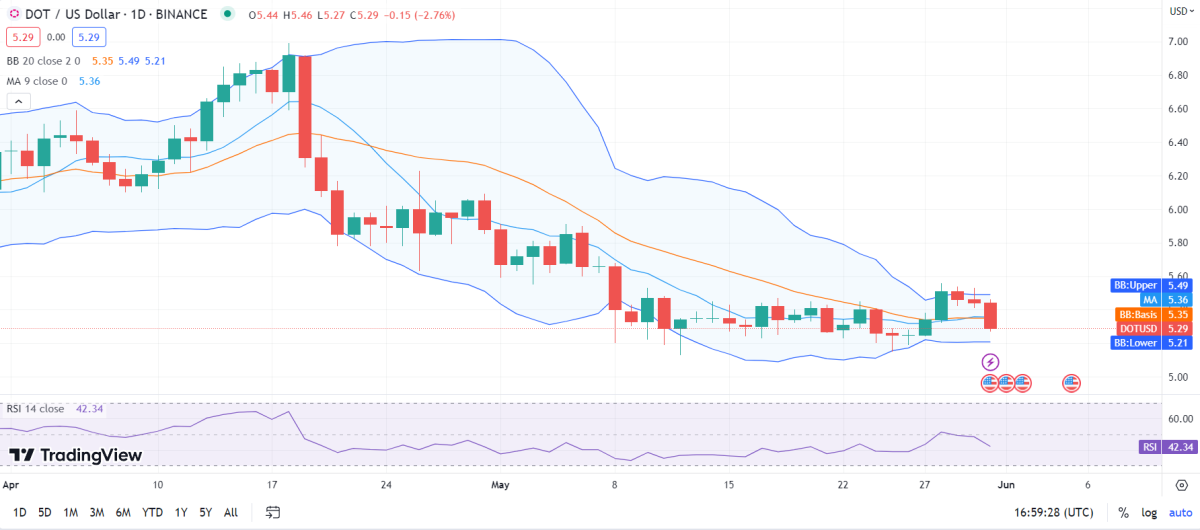
Based on the Polkadot price analysis, the Relative Strength Index (RSI) for Polkadot is currently at 42, which is a stable position. The RSI score is in the central-neutral region. However, it is worth noting that the RSI score is following a downward trend, which could indicate a change in the positive trend of the cryptocurrency.

Polkadot Price Analysis Conclusion

Based on the Polkadot price analysis, it appears that the cryptocurrency has significant potential for further downward movement in the market. However, at the moment, the market seems to be favoring a potential breakout, which could prove advantageous to the bulls.

Disclaimer. The information provided is not trading advice. Cryptopolitan.com holds no liability for any investments made based on the information provided on this page. We strongly recommend independent research and/or consultation with a qualified professional before making any investment decision.

文章来源于互联网:Polkadot price analysis: DOT declines tremendously to $5.29

Disclaimers:

1. You are solely responsible for your investment decisions and this info is not liable for any losses you may incur.

2. The copyright of this article belongs to the writer, it represents the writer's opinions only, not represents the site's ones. Not financial advice.

Previous 2023年6月4日 11:38
Next 2023年6月4日 12:31

Related articles

  • Binance Pay is taking Africa and South Asia by storm

    TL;DR Breakdown Binance Pay, the payment arm of Binance, is making significant inroads into Africa and South Asia, connecting cryptocurrencies with everyday goods and services. Launched in 2021, Binance Pay now boasts over 30 million users and has been adopted by numerous online merchants and real-world retailers. The payment service is particularly popular in regions such as Africa, South Asia, and the Eurasian countries within the Commonwealth of Independent States. The world’s largest cryptocurrency exchange, Binance, has carved out a niche for itself in Africa and South Asia through its payments service, Binance Pay. As it expands its sphere of influence, this digital payment system is making significant strides in connecting cryptocurrencies with tangible goods and services, according to Pakning Luk, a regional business development leader at Binance. Binance Pay: Bridging the gap A brainchild of the crypto giant, Binance Pay came to life in 2021 and has since grown rapidly, boasting over 30 million users across various regions. Its appeal extends from virtual markets to brick-and-mortar retailers, highlighting its versatility and commitment to bringing cryptocurrency to the forefront of…

    Article 2023年5月27日
  • Casio collaborates with Polygon Labs to launch virtual G-SHOCK NFTs on Polygon

    TL;DR Breakdown Casio partners with Polygon Labs to introduce G-SHOCK NFTs, starting with a creator pass collection. Community engagement, global accessibility, and Polygon’s blockchain expertise drive Casio’s entry into the NFT space. Description The Japanese electronics giant Casio is making waves in non-fungible tokens (NFTs) by partnering with Ethereum scaling developer Polygon Labs. The collaboration aims to introduce Casio’s iconic G-SHOCK watches into the NFT space on Polygon’s blockchain protocols. The project starts with releasing an NFT-based collection of community access passes. Contents hide 1 The NFT collection … Read more The Japanese electronics giant Casio is making waves in non-fungible tokens (NFTs) by partnering with Ethereum scaling developer Polygon Labs. The collaboration aims to introduce Casio’s iconic G-SHOCK watches into the NFT space on Polygon’s blockchain protocols. The project starts with releasing an NFT-based collection of community access passes. Contents hide 1 The NFT collection debut 2 Community-Driven creativity 3 Why Polygon? 4 Casio Joins the NFT Wave on Polygon 5 Navigating NFT challenges 6 Conclusion The NFT collection debut Starting September 23rd, enthusiasts and G-SHOCK fans can claim…

    Article 2023年9月5日
  • New financial documents show Trump capitalizing on NFT boom, holding up to $500k in Ethereum

    TL;DR Breakdown Donald Trump holds a notable amount of cryptocurrency, linked to a successful NFT venture. Trump’s Ethereum wallet contains between $250,000 and $500,000, attributed to his post-presidential NFT activities. His $99-themed trading cards, featuring his image, garnered $8.9 million after selling out twice. Description Donald Trump, the 45th President of the United States, has changed his tune. New financial documents that paint a different picture have surfaced: Trump holds a substantial amount of cryptocurrency, closely tied to a highly profitable NFT boom. According to the latest financial filings, Trump’s Ethereum-related cryptocurrency wallet boasts an impressive sum. It holds between … Read more Donald Trump, the 45th President of the United States, has changed his tune. New financial documents that paint a different picture have surfaced: Trump holds a substantial amount of cryptocurrency, closely tied to a highly profitable NFT boom. According to the latest financial filings, Trump’s Ethereum-related cryptocurrency wallet boasts an impressive sum. It holds between $250,000 and $500,000. This revelation stems from Trump’s post-presidential venture into non-fungible tokens (NFTs). His $99 limited edition trading cards were an…

    Article 2023年8月13日
  • Should we have high hopes for U.S. jobs data?

    TL;DR Breakdown The upcoming U.S. jobs data is crucial for investors monitoring the economy’s health. Economists predict about 170,000 non-farm payrolls added in August. This growth, albeit slow, is enough to accommodate most new job market entrants. Description Anticipation is high, and the stakes even higher. Investors around the globe have their sights set on the latest job figures from the U.S., and it’s not just about the numbers. It’s about the implications those numbers have for the world’s premier economy, especially when whispers of a “soft landing” hang in the air. Reading … Read more Anticipation is high, and the stakes even higher. Investors around the globe have their sights set on the latest job figures from the U.S., and it’s not just about the numbers. It’s about the implications those numbers have for the world’s premier economy, especially when whispers of a “soft landing” hang in the air. Reading Between the Lines of Job Creation The murmur among economists suggests we’re looking at a month of steady job creation. Projections hint at around 170,000 non-farm payrolls added in…

    Article 2023年8月28日
  • Ripple vs. SEC: A decision looms, but regulatory clarity fights on

    TL;DR Breakdown Ripple Labs’ legal battle with the SEC stands out in crypto regulation. Since December 2020, Ripple, the blockchain payments business behind the XRP currency, has been fighting the SEC.  Garlinghouse also warned that the company’s legal battle with the SEC is “coming to a close.” Still, it is only the beginning of a larger conflict for the sector, and regulatory clarity “has to continue.” Garlinghouse claimed that “at worst,” Hinman “deliberately ignored the law” and attempted to “create new laws.” In view of possible SEC action against more crypto firms, he underlined the significance of industry collaboration. Description Ripple Labs’ legal dispute with the U.S. Securities and Exchange Commission (SEC) stands out in the dynamic world of crypto regulation. Since December 2020, Ripple, the blockchain payments company behind the XRP crypto, has been engaged in a legal battle with the SEC.  Ripple’s CEO, Brad Garlinghouse, has stressed the importance of ongoing efforts to … Read more Ripple Labs’ legal dispute with the U.S. Securities and Exchange Commission (SEC) stands out in the dynamic world of crypto regulation. Since…

    Article 2023年6月20日
TOP