Liquity price analysis: LQTY struggles at $1.211 as bears reinforce control

TL;DR Breakdown

  • Liquity price analysis shows LQTY is facing a decline today.
  • Price levels have lowered to the $1.211 value.
  • A further drop may cause the price to go below $1.897 support.

The current Liquity price analysis reveals a significant downturn in the price, as the LQTY bulls face notable challenges in the market. The price has been steadily declining at a faster pace, causing it to reach a new low of $1.211. Despite the bulls’ attempts to push the price higher in the previous session, they have struggled to overcome the prevailing bearish momentum that has gained strength today. At present, the bulls are focused on preventing the crucial support level at $1.897 from giving way to further downside pressure. This critical level holds the key to determining the near-term trajectory of Liquity’s price.

LQTY/USD 1-day price chart: Bears initiate their struggle for a lower price

The 1-day Liquity price analysis indicates a decline in price as the bears make a comeback, challenging the bulls for dominance. Over the past four days, the cryptocurrency has experienced significant growth, with a continuous increase in price. However, today’s drop has been too substantial for the bulls to overcome. The selling pressure has been strong enough to push the price down to $1.211. Despite the bull’s lead in the previous week, today’s market conditions have caused the price to slip below the moving average (MA).

lqty1doiaLiquity price analysis: LQTY struggles at <img decoding=
LQTY/USD 24-hours price chart. Source: Tradingview

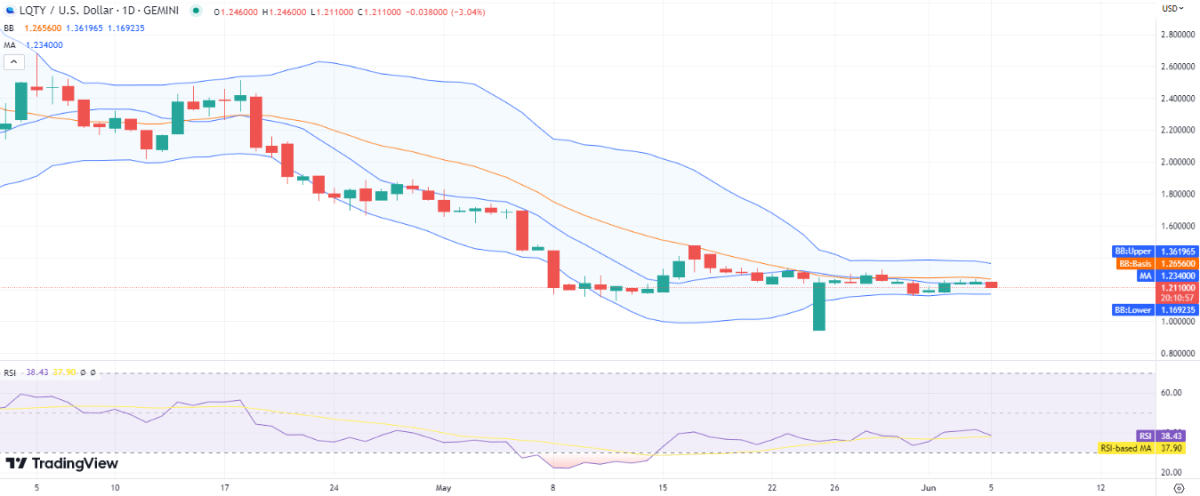
The current market conditions for LQTY/USD indicate low volatility, which is generally considered a negative sign. The Bollinger bands are reflecting this sentiment, with the upper band positioned at $1.361 and the lower band at $1.169. These values suggest a tight trading range and limited price movement. Additionally, the Relative Strength Index (RSI) score is decreasing and currently stands at 38, further indicating a strengthening bearish momentum in the market.

Liquity price analysis: Recent developments and further technical indications

Based on the 4-hour Liquity price analysis, there is a significant bearish activity unfolding as the price dropped to $1.211 within the last four hours. This recent development has acted as a catalyst for the bearish trend, with no notable resistance from the bulls. The price has now fallen below both the moving average and the SMA 50 curve, with the former situated at $1.244 and the latter at $1.235.

lqty4hkoposLiquity price analysis: LQTY struggles at <img decoding=
LQTY/USD 4-hours price chart. Source: Tradingview

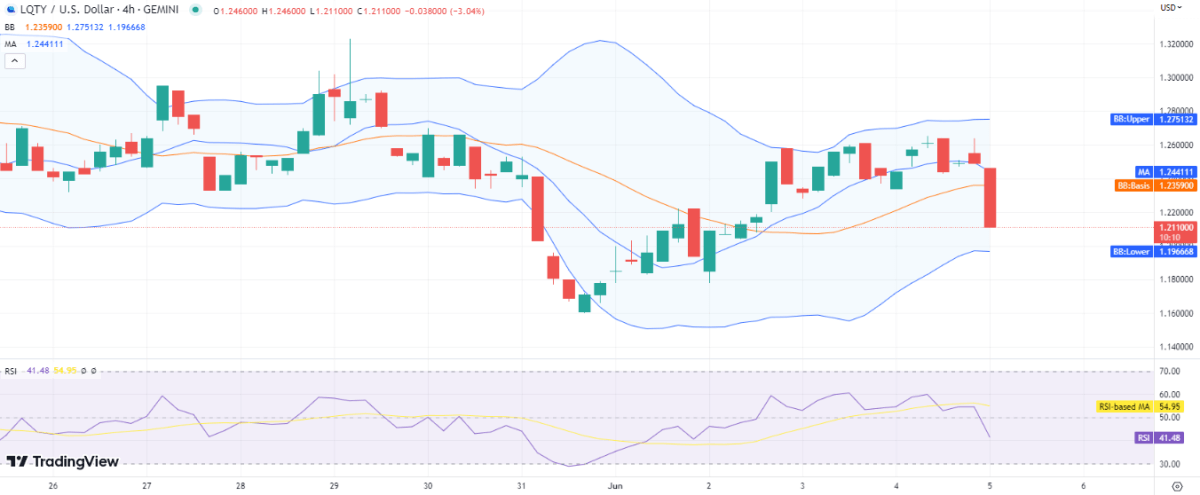
The volatility has decreased, which is why the upper Bollinger band value is at $1.275 and the lower Bollinger band value is at $1.196 right now. Meanwhile, the RSI score has also decreased because of the bearish pressure and has moved down to index 41, as the steep downward curve of the indicator hints at high selling pressure in the market.

Liquity price analysis conclusion

The provided 1-day and 4-hour Liquity price analysis is indicating a bearish outlook for the day, as the bears have successfully pushed the price levels down to $1.211 once again. Although the bulls made attempts yesterday to exert their influence and drive the price higher, today’s price action has completely favored the bears, leading to negative movement. Despite the bulls’ efforts, the bears have regained momentum and are now targeting the critical support level of $1.897.

Disclaimer. The information provided is not trading advice. Cryptopolitan.com holds no liability for any investments made based on the information provided on this page. We strongly recommend independent research and/or consultation with a qualified professional before making any investment decisions.

文章来源于互联网:Liquity price analysis: LQTY struggles at $1.211 as bears reinforce control

Disclaimers:

1. You are solely responsible for your investment decisions and this info is not liable for any losses you may incur.

2. The copyright of this article belongs to the writer, it represents the writer's opinions only, not represents the site's ones. Not financial advice.

Previous 2023年6月9日 13:12
Next 2023年6月9日 16:04

Related articles

  • Polkadot price analysis: DOT increases value at $5.29

    TL;DR Breakdown Polkadot price analysis is bullish today. The strongest resistance is present at $5.46. The strongest support is present at $5.23. Polkadot price analysis reveals a relatively upbeat approach today; the price has gained most of its lost value. In recent days, there has been a notable upsurge in the overall market sentiment favoring DOT (Polkadot), leading to a significant appreciation in its value. On May 25, the cryptocurrency witnessed an abrupt increase from $5.16 to $5.28. Subsequently, it sustained positive momentum throughout the day, ultimately rebounding to a peak value of $5.29. On May 27, 2023, the price of DOT reached significant heights, reaching a pinnacle of $5.29 and maintaining this elevated level throughout the day. Currently, the cryptocurrency’s price exhibits relative stability, hovering around $5.29. Polkadot’s present market conditions indicate that it is currently priced at $5.30, with a trading volume of $158.68 million over the past 24 hours. Its market capitalization stands at $5.23 billion, and it holds a market dominance of 0.46%. Notably, the price of Polkadot has experienced a 1.29% increase in the last 24…

    Article 2023年5月29日
  • Mastering China: UBS reveals winning strategy amid tensions

    TL;DR Breakdown UBS provides a strategy for navigating China’s volatile economic landscape. Emphasis on key policy areas like property easing, private sector support, and local government debt solutions. Description With the looming unpredictable clouds over China’s economic landscape, UBS has recently shed some light on how to navigate this turbulent financial storm. Drawing upon their insights and expertise, they’ve carved a roadmap for investors who are brave enough to venture into this complex territory. UBS: Finding Opportunity amidst the Chaos UBS doesn’t shy away … Read more With the looming unpredictable clouds over China’s economic landscape, UBS has recently shed some light on how to navigate this turbulent financial storm. Drawing upon their insights and expertise, they’ve carved a roadmap for investors who are brave enough to venture into this complex territory. UBS: Finding Opportunity amidst the Chaos UBS doesn’t shy away from acknowledging the dynamic and volatile nature of the Chinese market. Their recent directives to investors revolve around anticipating and leveraging key policy-related measures. These encompass areas such as property easing, private sector aid, consumption incentives, and resolving…

    Article 2023年9月4日
  • The shocking costs of Bitcoin mining

    TL;DR Breakdown A recent CoinGecko study revealed that the average electricity cost to mine a single Bitcoin at the household level is $46,291.24, with significant cost disparities across regions. While Europe has the highest average household electricity cost for mining, Asia offers the most profitability, with 34 out of 65 countries providing cost-effective solo Bitcoin mining. Despite potential profits, nine countries have banned cryptocurrency mining, trading, and use, yet most of these nations still offer profitable solo Bitcoin mining opportunities. Description In a recent study by CoinGecko, the costs associated with Bitcoin mining at the household level were analyzed, revealing significant disparities across different regions. The study shows that Europe and Australia are the most expensive regions for mining Bitcoin, followed by the United States. On the other hand, some countries in West Asia and North … Read more In a recent study by CoinGecko, the costs associated with Bitcoin mining at the household level were analyzed, revealing significant disparities across different regions. The study shows that Europe and Australia are the most expensive regions for mining Bitcoin, followed by…

    Article 2023年8月20日
  • ECB explains why it asked banks for weekly liquidity stats

    TL;DR Breakdown The European Central Bank (ECB) is increasing its monitoring of banks’ liquidity by asking for weekly data reports from September. This move aims to provide more timely evaluations of banks’ ability to counteract financial shocks amid rising interest rates. ECB Supervisory Chief, Andrea Enria, acknowledged that European banks are stronger than before but stated that the financial markets are in a “delicate phase” due to several global issues. Description In an ongoing effort to fortify the financial landscape and reinforce banking resilience in Europe, the European Central Bank (ECB) has outlined a strategic move to heighten its monitoring of banks’ liquidity. Beginning in September, banks will need to supply their liquidity data on a weekly basis, rather than monthly as currently mandated. The aim … Read more In an ongoing effort to fortify the financial landscape and reinforce banking resilience in Europe, the European Central Bank (ECB) has outlined a strategic move to heighten its monitoring of banks’ liquidity. Beginning in September, banks will need to supply their liquidity data on a weekly basis, rather than monthly as…

    Article 2023年7月23日
  • Tether reaches all-time high market cap and expands presence in Georgia

    TL;DR Breakdown Tether’s USDT stablecoin has regained its lost market value, surpassing its all-time high market cap of $83.2 billion. The decline in whale holdings of Ethereum raises concerns about a bearish outlook in the market, potentially impacting price stability. Tether expands its presence in Georgia through a strategic investment in CityPay.io, aiming to enhance the payment industry and bring greater efficiency and convenience to customers. Tether, the leading stablecoin issuer, has recently made significant strides in the crypto market, reaching new milestones and expanding its presence in Georgia. The company’s updates and strategic investments showcase the growth and resilience of Tether amidst a dynamic industry. Tether rebounds and surpasses all-time high market cap After experiencing a setback of approximately $20 billion following the collapse of algorithmic competitor TerraUSD over a year ago, Tether’s USDT stablecoin has successfully regained its lost market value. The circulating supply of this highly traded digital asset has surpassed its previous record of $83.2 billion, establishing a new all-time high. This achievement demonstrates the strong demand for Tether tokens and individuals’ desire for financial freedom….

    Article 2023年6月5日
TOP