Polkadot price analysis: DOT corrects lower at $5.06 after a bearish divergence

TL;DR Breakdown

  • Polkadot price analysis shows a bearish trend
  • Support for DOT is present at $4.94
  • DOT is down by 5.31% as price corrects lower

The Polkadot price analysis indicates a strong bearish sentiment in the market. DOT/USD pair has been on a downward trajectory since the start of today and is now at $5.05 and nearly 5.31% down from its opening price of $5.35. The market crash is strong as the bears are in full control of the price movement, and any attempts to break out of this bearish momentum have been unsuccessful.

The support level for Polkadot is $4.94, a zone where buying pressure has been strong enough to try and push the price back up. A successful breakout of this level could see DOT/USD pair rise once again. The resistance is present at $5.30, which needs to be broken for bullish sentiment to take over and allow the price to rise further.

Polkadot price analysis 1-day chart: DOT trades in a bearish zone

The one-day  Polkadot price analysis is confirming a decline in coin value, as the price has been following a bearish trend for the day. The price has been rangebound between $4.94 and $5.09, and the lower support at this level keeps getting violated. As of now, the DOT price is hovering around the $5.06 mark, and the bearish trend is likely to continue in the coming days. 

image 164Polkadot price analysis: DOT corrects lower at .06 after a bearish divergence
DOT/USD 1-day price chart. Source: TradingView

The moving average indicator is also adding further confirmation to the bearish divergence, as the 50-day MA is below the 200-day MA. The MACD line has crossed into negative territory and currently resides around -0.091. This indicates that there could be more downside in store for DOT prices in the near future. The relative strength index (RSI) is also in the bearish zone and has broken below the 50-level, indicating that selling pressure is still dominating the market. 

Polkadot price analysis: DOT price retraces to $5.06 as bears gain momentum

The hourly Polkadot price analysis is still on the bearish side, as DOT has been declining slowly and steadily since the start of today. The market opened trading at $5.19 and has been on a downward trend since then. The market has formed a descending triangle pattern, and the price has broken down from the upper trendline, which signals further bearishness in the DOT market.

image 163Polkadot price analysis: DOT corrects lower at .06 after a bearish divergence
DOT/USD 4-hour price chart. Source: TradingView

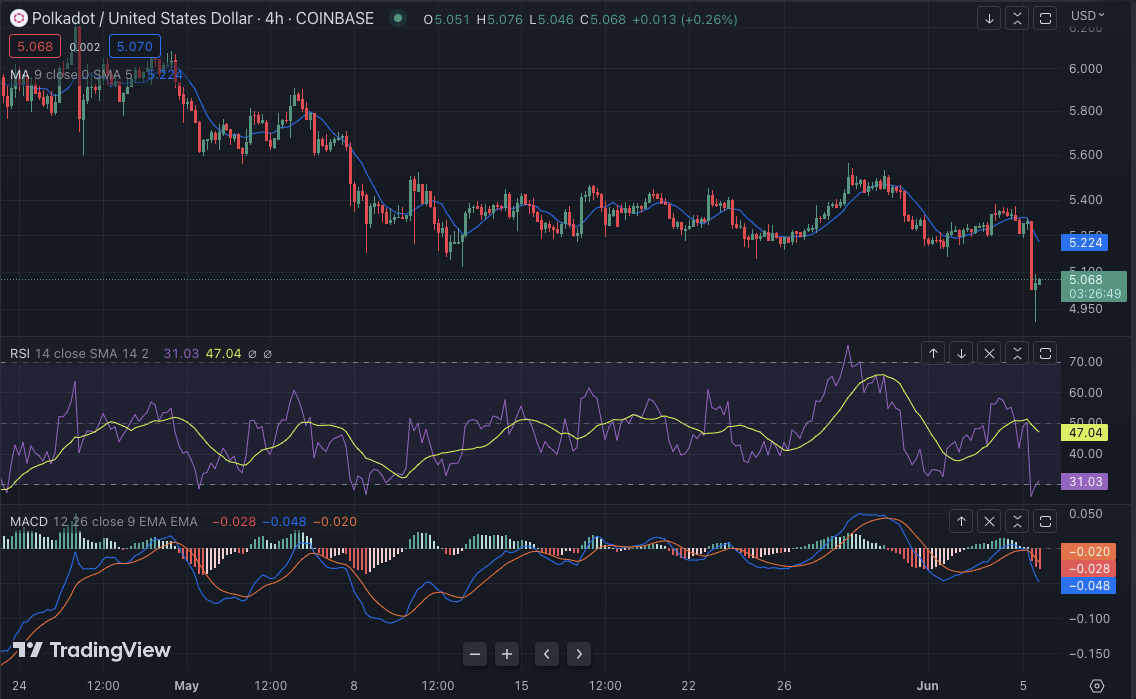
The moving average convergence/divergence (MACD) indicator is also confirming the bearish sentiment, as the signal line has moved below the MACD line, indicating a potential bearish crossover. The relative strength index (RSI) is also near the oversold zone, currently at 31.03 and trending lower, which confirms that the selling pressure is strong and could push prices even lower from current levels. The moving average indicator is currently at $5.22, where the 50-day MA is below the 200-day MA, confirming that Polkadot prices are in a bearish trend. 

Polkadot price analysis conclusion

Overall, the Polkadot price analysis shows that DOT/USD pair is currently in a bearish trend and could potentially continue to move lower if buying pressure does not pick up soon. The technical indicators are also confirming the bearish divergence, as the selling pressure is dominating the market. The support and resistance levels should be watched closely in the coming days, as any breakout from either of these could signal a change in trend.

Disclaimer. The information provided is not trading advice. Cryptopolitan.com holds no liability for any investments made based on the information provided on this page. We strongly recommend independent research and/or consultation with a qualified professional before making any investment decisions.

文章来源于互联网:Polkadot price analysis: DOT corrects lower at $5.06 after a bearish divergence

Disclaimers:

1. You are solely responsible for your investment decisions and this info is not liable for any losses you may incur.

2. The copyright of this article belongs to the writer, it represents the writer's opinions only, not represents the site's ones. Not financial advice.

Previous 2023年6月10日 16:06
Next 2023年6月10日 19:29

Related articles

  • Russia’s digital ruble set to pilot amid economic challenges

    TL;DR Breakdown Russia is initiating a digital Ruble pilot, despite economic challenges and international isolation from the Ukraine conflict. The Federation Council has passed legislation approving the digital Ruble. Tests may begin next month. The digital Ruble could ease cross-border payments and increase internal transaction transparency. Description As the global economy steers towards digitization, Russia propels its own monetary evolution by piloting the digital Ruble, an innovation maneuvered in the midst of formidable economic obstacles. Overcoming international isolation due to the Ukraine conflict, Russia’s journey into the digital currency realm manifests the nation’s resilience and strategic foresight. The launch of Russia’s digital … Read more As the global economy steers towards digitization, Russia propels its own monetary evolution by piloting the digital Ruble, an innovation maneuvered in the midst of formidable economic obstacles. Overcoming international isolation due to the Ukraine conflict, Russia’s journey into the digital currency realm manifests the nation’s resilience and strategic foresight. The launch of Russia’s digital ruble The blueprint for Russia’s digital currency received a green light from the Federation Council, Russia’s upper house of parliament….

    Article 2023年7月20日
  • SPACE ID price analysis: ID price surges to $0.472, following an ascending trend

    TL;DR Breakdown SPACE ID price analysis is bullish today. Support for ID/USD is present at $0.430. Resistance for ID is found at $0.501. The latest SPACE ID price analysis predicts that the ID price is poised for a bullish trend throughout the day. While the bears held control in recent days, inflicting damage on ID’s price and maintaining a downward trend, the scenario has changed today. The bulls have managed a steady comeback, albeit slow progress, elevating the price above the $0.473 level. This shift signals a prevailing upward trend dictating the market today. ID/USD 1-day price chart: Strong bullish momentum boosts progress chances Based on the 1-day SPACE ID price analysis, the bulls have taken the upper hand. Their strong bullish momentum has facilitated a remarkable recovery, pushing the price back up to $0.473 and registering a gain of at least 2.26 percent over the past 24 hours. This resurgence is highly encouraging for buyers, considering the previous downward trajectory. Today, the bulls have made an impressive comeback, propelling the price toward further upside movement. However, it’s important to…

    Article 2023年5月25日
  • MicroStrategy posts impairment charge of $24 million in Bitcoin holdings; returns to profitability amid Bitcoin surge

    TL;DR Breakdown MicroStrategy returned to profitability in Q2 2023, reporting a net income of $22.2 million, contrasting with a net loss of $1.1 billion last year, largely due to reduced Bitcoin impairment charges. The company increased its Bitcoin holdings to 152,800 bitcoins worth approximately $4.5 billion and plans to sell up to $750 million in stocks for further Bitcoin acquisition. MicroStrategy’s share price has risen nearly 200% to $434.98, reflecting Bitcoin’s upward trend, though Q2 revenue fell slightly short of analyst estimates. Description In its second quarter, MicroStrategy (MSTR) recorded an impairment charge of $24.1 million on its Bitcoin (BTC) holdings, according to the latest earnings report. However, this is a notable decrease from the $917.8 million recorded in the same quarter of the previous year, and a slight increase from $18.9 million in Q1. The impairment reflects … Read more In its second quarter, MicroStrategy (MSTR) recorded an impairment charge of $24.1 million on its Bitcoin (BTC) holdings, according to the latest earnings report. However, this is a notable decrease from the $917.8 million recorded in the same quarter…

    Article 2023年8月2日
  • This is going to be a horrible week for Apple – Why?

    TL;DR Breakdown Apple faces challenges with China clamping down on iPhone usage among its government officials. The iPhone 15 unveiling aims to outpace Samsung in the global handset market. Description September, with its transition from the carefree warmth of summer to the daunting chill of fall, often ushers in unexpected challenges. Just as the weather turns its back on the optimism of sunnier days, the tech giant Apple finds itself facing its own set of dark clouds as we venture further into the month. An … Read more September, with its transition from the carefree warmth of summer to the daunting chill of fall, often ushers in unexpected challenges. Just as the weather turns its back on the optimism of sunnier days, the tech giant Apple finds itself facing its own set of dark clouds as we venture further into the month. An Unexpected Party-Crasher in Beijing Apple’s been polishing its image and gearing up for a significant event. With the anticipated unveiling of the iPhone 15 on Tuesday, there was a palpable energy in the air. Rumors were buzzing,…

    Article 2023年9月11日
  • Brace yourself for massive losses – Crypto trends on dangerous waters

    TL;DR Breakdown The crypto market is in a free fall at the moment. Bitcoin is down 3% in the last 24 hours—having dropped to its lowest level in 3 months. The price slump is likely tied to the defunct crypto exchange FTX revealing the possible approval to liquidate $3.4B in Solana, BTC, ETH, and other digital assets. Arbitrum’s TVL has notably declined to $1.67B, marking its lowest level since mid-February, adding to the ongoing market pain. Description The crypto market is not doing well. And it may take on this sentiment for the whole week if not the whole month. As we navigate the volatile seas of the crypto market, it’s becoming increasingly clear that storm clouds are gathering on the horizon.  For both seasoned investors and newcomers alike, the tides have … Read more The crypto market is not doing well. And it may take on this sentiment for the whole week if not the whole month. As we navigate the volatile seas of the crypto market, it’s becoming increasingly clear that storm clouds are gathering on the horizon. …

    Article 2023年9月12日
TOP