
TL;DR Breakdown
- Weekly crypto price analysis shows most of the tokens have been trading in mixed reactions, with bull and bearish patterns emerging in the market.
- Bitcoin price analysis has been hovering below the $27,000 level for most days in the week, with minor corrections occurring in between.
- Ethereum has been trading below $1,700, with a slight downward trend.
Description
The Weekly crypto analysis reveals that most cryptocurrencies have been trading in mixed signals, with bullish and bearish trends visible in the market. On August 25th, Jerome Powell, the Chair of the Federal Reserve, delivered a lecture at the Jackson Hole symposium. During his address, Powell expressed concern about the persistently elevated levels of inflation … Read more
The Weekly crypto analysis reveals that most cryptocurrencies have been trading in mixed signals, with bullish and bearish trends visible in the market. On August 25th, Jerome Powell, the Chair of the Federal Reserve, delivered a lecture at the Jackson Hole symposium. During his address, Powell expressed concern about the persistently elevated levels of inflation and emphasized the Federal Reserve’s willingness to consider more interest rate hikes in response to this situation. Powell’s statements bolster the prevailing argument that interest rates are expected to persist at elevated levels for an extended duration.
Nevertheless, it is worth noting that following a short period of decline, the stock markets in the United States demonstrated a rebound from their lowest points during the trading day. Following the conclusion of the event, during which no significant price fluctuations occurred, traders have resumed speculating on the factors that may potentially influence market movements in the future.


The top coin and the altcoins have been trading in different directions this week. Bitcoin, the largest cryptocurrency by market capitalization, has seen minor price corrections from $27,000 to $26,000 levels over the course of the week. Ethereum has experienced a slight downward trend throughout the week and is currently trading slightly below $1,700 USD.
On the other hand, BNB and XRP prices have seen significant uptrends over the week as their respective projects made progress toward achieving more widespread adoption. The ADA price has been hovering around $0.2600 levels with bullish and bearish patterns in play. The DOGE price has been trading in a tight range, with some small fluctuations. Lastly, the SOL the Solana price has been holding steady at around $20.00 levels with no major price fluctuations.
BTC/USD
Bitcoin price analysis reveals that BTC has been trading mostly below $27,000 for the past days of the week as bears took control of the market. The price has made several small corrections towards $26,000 levels in between, but buyers have been able to hold up the support and keep the price from crashing further. Currently, the BTC is at $26,029, with a slight increase of 0.32 in the past 24 hours.

The 20-EMA is currently below the 50-EMA, indicating that bears still dominate the market. The relative strength index has been hovering at a neutral level, indicating that there is no clear direction for the price. The Moving average convergence/divergence (MACD) line has crossed up below the signal line but is still trending downwards, pointing to a bearish trend.
ETH/USD
Ethereum has been trading at a narrow range between $1,690 to $1,650 since the beginning of the week. The bullish and the bearish forces have been in equilibrium, with neither side able to gain the upper hand. At the time of writing, the ETH/USD pair is trading near the $1,647 level.

The support level at $1,600 has been holding up the ETH price so far, and if bears were to break through this support, the price could potentially experience a further downward correction. The 20-EMA is slightly below the 50-EMA, suggesting a bearish market sentiment. The RSI is currently neutral at 43, and the MACD line crossing below the signal line points towards further downward trends in the upcoming days.
BNB/USD
The Binance Coin (BNB) price has been trading in an ascending channel for some days in the week, with a few minor corrections taking place along the way. The BNB coin has been able to secure a strong support level at $215, and it is currently trading just below the $220 level; however, if the support at $215 were to break, it could potentially experience further bearish pressure. On the upside, the immediate hurdle lies at $220, and if cleared, BNB could move to higher levels above $225. Currently, the BNB/USD pair is trading at $216, with a 0.42% decrease in the past 24 hours.

The 20-SMA is trending above the 50-SMA, indicating a bullish sentiment in the market. The Relative strength index is hovering between 30 and 40, showing no clear direction for the price. The MACD line has crossed up above the signal line, suggesting that buyers may have a slight upper hand in the market.
DOGE/USD
Dogecoin (DOGE) price analysis reveals that it has been trading in a tight range with minor fluctuations to the upside and downside this week. At the time of writing, it is trading at $0.06288 levels, with a 0.65% decrease in the past 24 hours. Additionally, the DOGE token is down by 1.76% in the past 7 days after rallying to a weekly- high at $0.06458 on 20th August 2023.
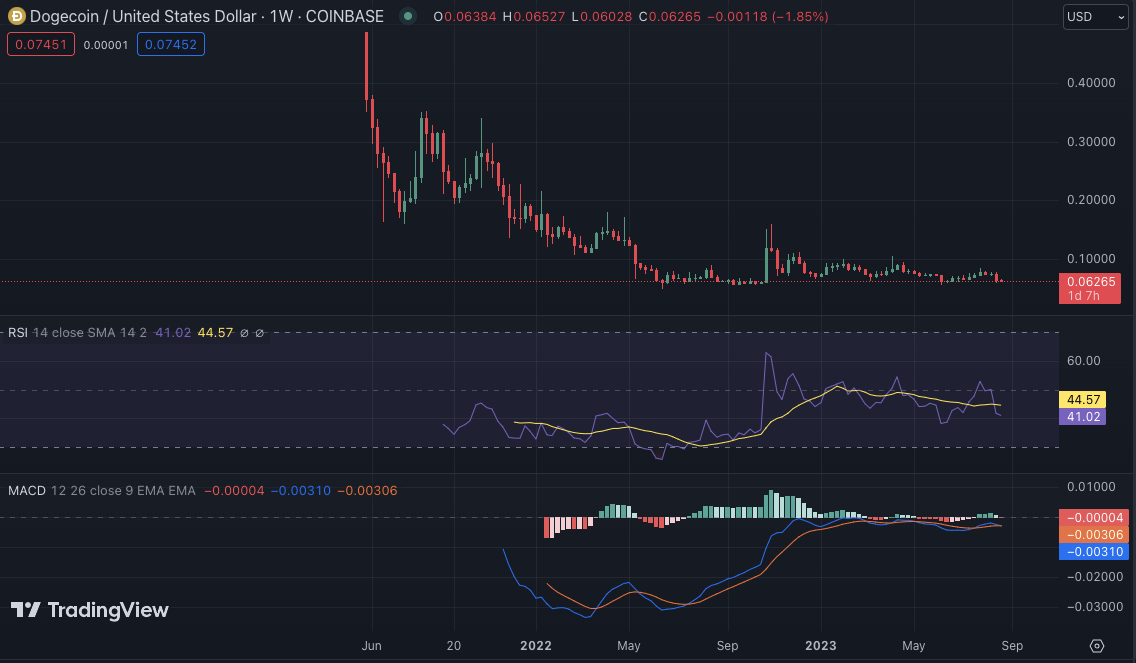
The weekly technical analysis reveals that most of the indicators are in the neutral zone at the moment, with no clear directions for the price. The relative strength index (RSI) is currently at 41.02, indicating a neutral market sentiment. The MACD line has crossed up below the signal line. However, it is still trending downwards.
XRP/USD
XRP price analysis reveals that after a period of bearishness towards the start of the week, XRP has been able to regain momentum and is currently trading up by 1.67% in the past 24 hours at $0.5243 levels. Additionally, XRP is also up by 0.94% in the past 7 days after a bullish occurrence at the beginning of the week.

The 20-EMA is trending above the 50-EMA, indicating a bullish market sentiment. The relative strength index (RSI) is currently at 49.63 and pointing towards a bullish trend with no clear signs of an overbought condition yet. The moving average convergence/divergence line (MACD) is above the signal line, signaling that buyers may have a slight upper hand in the market.
ADA/USD
The Cardano (ADA) price has been trading in neutral over the past week, with bullish and bearish patterns in play. At the time of writing, the ADA price is trading just below $0.2606 levels, with a 0.19% increase in the past 24 hours. ADA/USD pair has been hovering below the $0.300 resistance level since the beginning of the week. If buyers were able to break through this key resistance, it could potentially experience further upside movements.

The support level at $0.250 has been holding up the price so far, and if it were to break, ADA could experience further bearish pressure. The RSI is hovering just above 30 in neutral territory while the MACD line has crossed up below the signal line suggesting that bears may have a slight upper hand in the market.
SOL/USD
The Solana (SOL) price has been trading steadily around the $20.00 level for most of this week, with no major price fluctuations. At the time of writing, it is trading at $20.29, with a 0.22% decrease in the past 24 hours and an 8.23% decrease in the past 7 days. The bearish trend is mainly attributed to the overall downtrend of the cryptocurrency market.
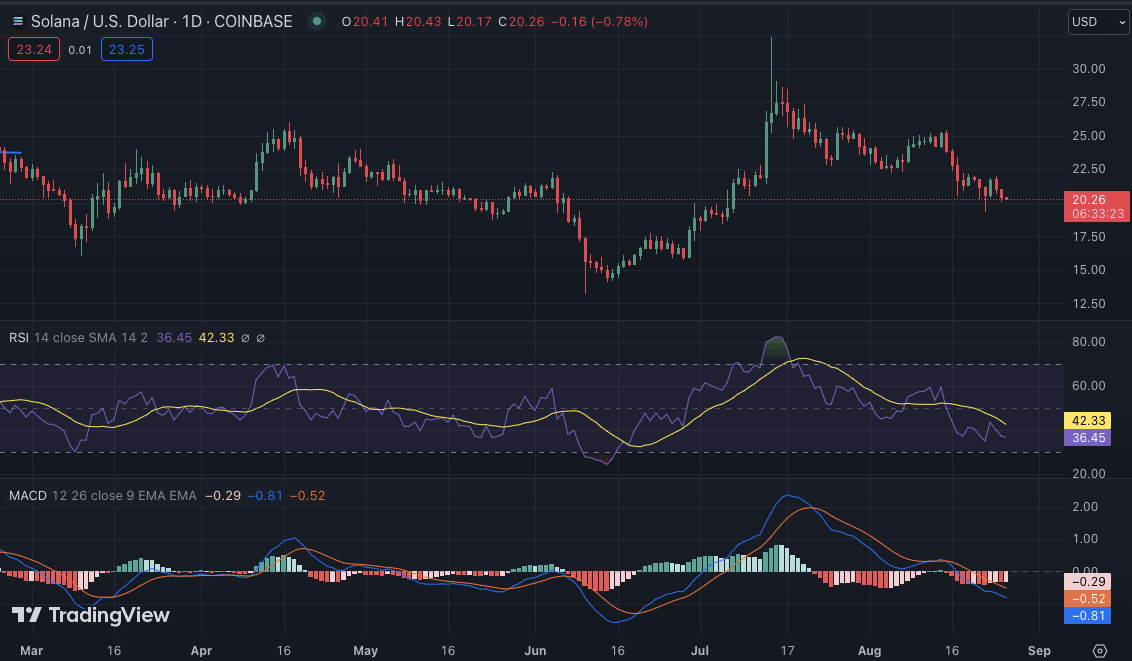
The 20-EMA is trending below the 50-EMA, suggesting a bearish market sentiment and the relative strength index (RSI) is hovering below the 50.00 level, indicating that the bears still dominate the market. The MACD line has crossed up below the signal line, pointing to further bearish pressure in the upcoming days.
Weekly Crypto Analysis Conclusion
Overall, the crypto market is in a period of consolidation, with most coins trading within range-bound conditions. The bullish and bearish divergences being seen on many coins indicate that there is a tug-of-war occurring between the bulls and bears. In the near term, it is likely that some coins will break out of their current levels and begin to rally higher, while others might drop lower.
文章来源于互联网:Weekly Crypto Price Analysis: BTC, ETH, BNB, DOGE, ADA, XRP, And SOL